Eddie Arrieta
Associate Research Analyst
Get to Know Eddie


Innovations in the field of weight loss are nothing new, as the first generation of products designed to provide individuals with slimmer waistlines were first developed nearly 100 years ago. These products primarily consisted of stimulants, such as dinitrophenol and methamphetamine. The healthcare industry has since moved on from such stimulants as other products have come to market in recent time, including Saxenda by Novo Nordisk. Saxenda, which was approved by the U.S. Food and Drug Administration (FDA) in 2014, represents the first GLP-1 product designed for weight loss management. A second Novo Nordisk product, Wegovy, was approved by the FDA in 2021. Indeed, these and other GLP-1s have been on the market for several years now, however, investors took particular note of these products in 2023, which led to notable impacts across the healthcare space in terms of equity performance.
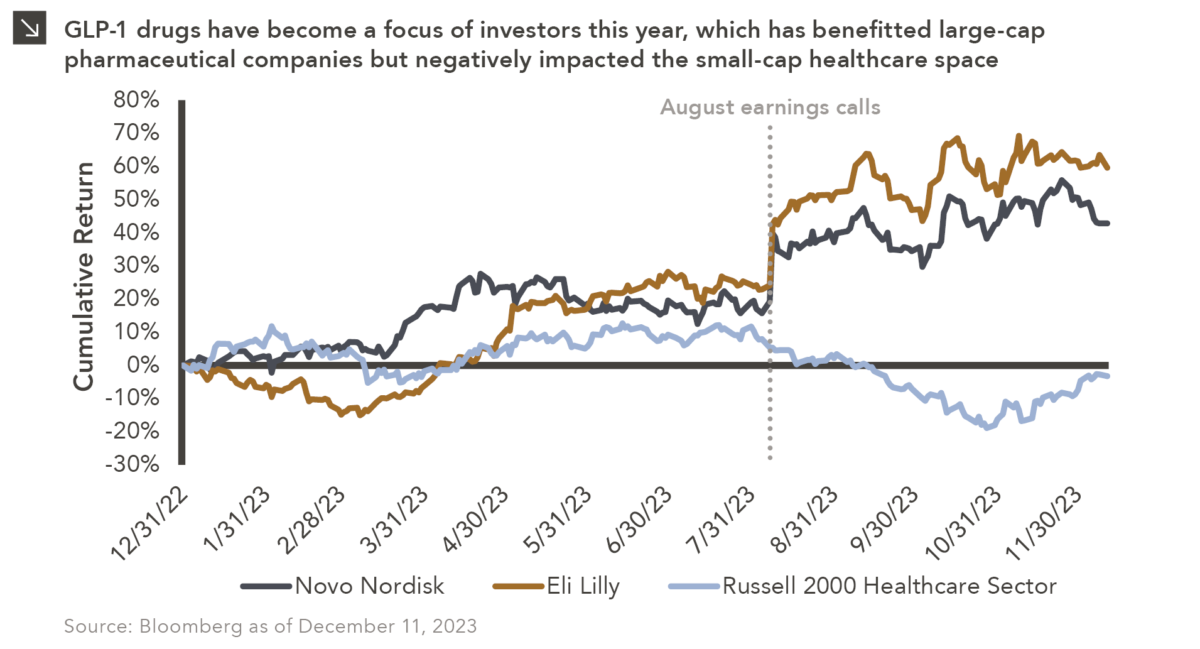
On the positive side, many large-cap pharmaceutical companies, including Novo Nordisk and Eli Lilly, have benefitted from increased investor focus on GLP-1s this year. In August, new guidance related to these drugs was issued during the earnings calls for both businesses, fueling upticks in their respective share prices as shown in this week’s chart. Specifically, Novo Nordisk reported sales growth of 157% for its obesity-related drugs, with North American operations growing sales for these products by a staggering 207%. Elli Lilly also shared positive news on its August earnings call with investors, including robust sales growth of Mounjaro, the company’s diabetes drug. This growth led to investor optimism related to the potential of Elli Lilly’s weight loss management drug Zepbound, which was ultimately approved by the FDA in November. As of the time of this writing, the share prices of Novo Nordisk and Eli Lilly are up roughly 42.8% and 59.6%, respectively, on a year-to-date basis. Negative impacts stemming from increased investor focus on GLP-1s were primarily observed within the small-cap space, specifically the healthcare sector of the Russell 2000 Index. To that point, the weight loss products detailed above caused some investors to question the extent to which other healthcare products and services, including orthopedic surgeries and sleep apnea machines, would be utilized by new and existing patients going forward. This uncertainly led to a decline of the healthcare sector of the Russell 2000 Index of roughly 25% in the three months leading into November, though the space has recovered some of those losses within the last several weeks.
Even though GLP-1 drugs have been available in the market for some time, their adoption for weight loss management remains nascent and has investors excited for the future of the healthcare space. Time will tell how successful and disruptive these products will ultimately prove, and Marquette will continue to monitor the impact of these drugs on equity markets, both broadly and at the sector level.
Print PDF
The opinions expressed herein are those of Marquette Associates, Inc. (“Marquette”), and are subject to change without notice. This material is not financial advice or an offer to purchase or sell any product. Marquette reserves the right to modify its current investment strategies and techniques based on changing market dynamics or client needs.

10.08.2026
This video is a recording of a live webinar held October 22 by Marquette’s research team analyzing the third quarter…

10.22.2026
Anyone who has run a marathon knows the last six miles are brutal — no matter how well the first…

10.19.2026
Since 1980, the S&P 500 Index has generally performed well in the weeks surrounding U.S. midterm elections. Specifically, the index…

10.12.2026
This week’s chart highlights the accelerating growth of electricity demand in the U.S., which has been driven primarily by the…

10.05.2026
For investors, the spookiest thing about October might not be the ghosts and monsters that are bound to show up…

09.28.2026
The phrase “expectations of higher inflation” has become a staple in financial news to explain the increase in nominal U.S….
Research alerts keep you updated on our latest research publications. Simply enter your contact information, choose the research alerts you would like to receive and click Subscribe. Alerts will be sent as research is published.
We respect your privacy. We will never share or sell your information.
If you have questions or need further information, please contact us directly and we will respond to your inquiry within 24 hours.
Contact Us >