Catherine Hillier
Senior Research Analyst
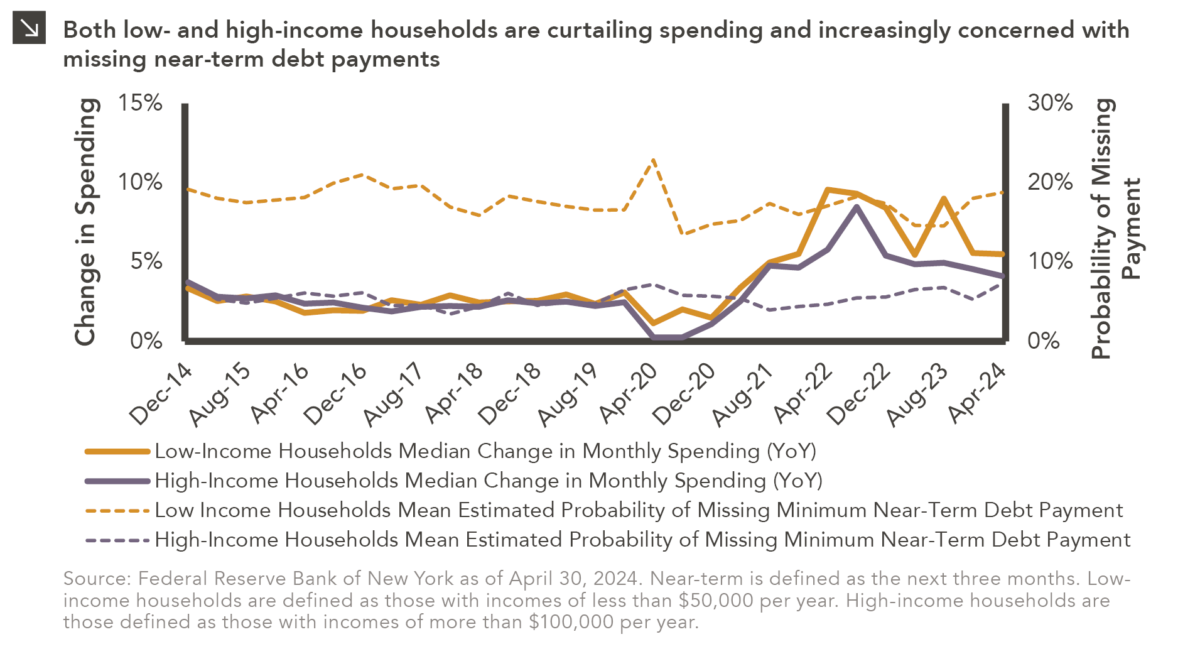
The resilience of the American consumer has been an unanticipated phenomenon in the four years since the outbreak of the COVID-19 virus. Massive federal stimulus in the wake of the pandemic provided the means for significant discretionary spending and has been a major contributor to overall economic strength, even as corporate earnings have wavered. Although consumer activity remains elevated relative to pre-pandemic levels, it has fallen from highs exhibited in mid-2022. At the same time, the percentage of Americans concerned with meeting certain financial obligations has ticked up, with roughly 19% of households earning less than $50,000 per year now questioning their ability to make minimum near-term debt payments, according to a recent Federal Reserve survey. This figure represents a level not seen since the onset of the pandemic. Concerns regarding debt payments among high-income households, or those with more than $100,000 in annual income, have also seen a notable increase over the last several months. These dynamics, as well as overall spending patterns for both low- and high-income households, are highlighted in this week’s chart.
It is worth exploring the extent to which consumer behaviors may have changed in light of the elevated concerns detailed above. To that point, recent corporate earnings reports speak to pressures faced by higher-income households by showing “trade down” effects, which occur when high earners increase spending on cost-efficient products. Walmart, for instance, reported an increase in sales in its latest earnings report which was largely driven by upper-income households. As consumer sentiment dropped to a six-month low in May, the retail giant also reported that shoppers continue to prioritize staples, which has helped propel growth in its grocery business. Other retailers like Five Below and Dollar Tree also show evidence of trade down effects and continue to issue warnings that consumers of all types remain under pressure from macroeconomic factors like inflation and higher interest rates.
Determining the future trajectory of consumer spending is a challenge for corporations as management teams attempt to right-size budgets and chart paths forward. While the difficulties faced by low-income consumers have been largely recognized for some time, increased trade down effects and concerns about debt payments from high-income consumers are more recent developments. In general, it appears as though consumers are becoming less tolerant of the higher prices many companies pushed through over the last several quarters. Should consumer savings and sentiment continue to fall, discretionary spending may decline as Americans across the income spectrum prioritize staples and lower-cost goods. This may prove to be a headwind for certain industries, including high-end retailers and restaurants.
Print PDF
The opinions expressed herein are those of Marquette Associates, Inc. (“Marquette”), and are subject to change without notice. This material is not financial advice or an offer to purchase or sell any product. Marquette reserves the right to modify its current investment strategies and techniques based on changing market dynamics or client needs.

06.15.2026
The rapid buildout of artificial intelligence infrastructure is reshaping the U.S. investment landscape. According to recent Census Bureau data, spending…

06.08.2026
Hi, James Torgerson here! Volatility can be an unsightly blemish on portfolios and lead to inferior risk-adjusted returns. Private credit…

06.01.2026
The MSCI Emerging Markets Index has undergone a significant structural transformation in recent years. For much of the past decade,…

05.26.2026
The classic novel A Tale of Two Cities by Charles Dickens begins with the line “It was the best of…

05.18.2026
Over the last few years, equity markets have been defined by a group of stocks often referred to as the…

05.11.2026
In addition to the humanitarian toll of the conflict in Iran, the world is currently confronting the impact that trade…
Research alerts keep you updated on our latest research publications. Simply enter your contact information, choose the research alerts you would like to receive and click Subscribe. Alerts will be sent as research is published.
We respect your privacy. We will never share or sell your information.
If you have questions or need further information, please contact us directly and we will respond to your inquiry within 24 hours.
Contact Us >