Pulling the Right Value Creation Levers

March 30, 2026 | Pooja Vyas, Research Analyst

Stacked column chart comparing contribution to total value creation broken out by revenue growth, margin expansion, and multiple expansion for private equity managers, by exit year, 2017 to 2024. 2017 column 45% revenue growth, 26% margin expansion, 29% multiple expansion. 2018 column 56% revenue growth, 4% margin expansion, 40% multiple expansion. 2019 column 43% revenue growth, 10% margin expansion, 47% multiple expansion. 2020 column 42% revenue growth, 19% margin expansion, 39% multiple expansion. 2021 column 46% revenue growth, 13% margin expansion, 42% multiple expansion. 2022 column 53% revenue growth, 20% margin expansion, 27% multiple expansion. 2023 column 64% revenue growth, 19% margin expansion, 17% multiple expansion. 2024 column 71% revenue growth, 12% margin expansion, 17% multiple expansion.

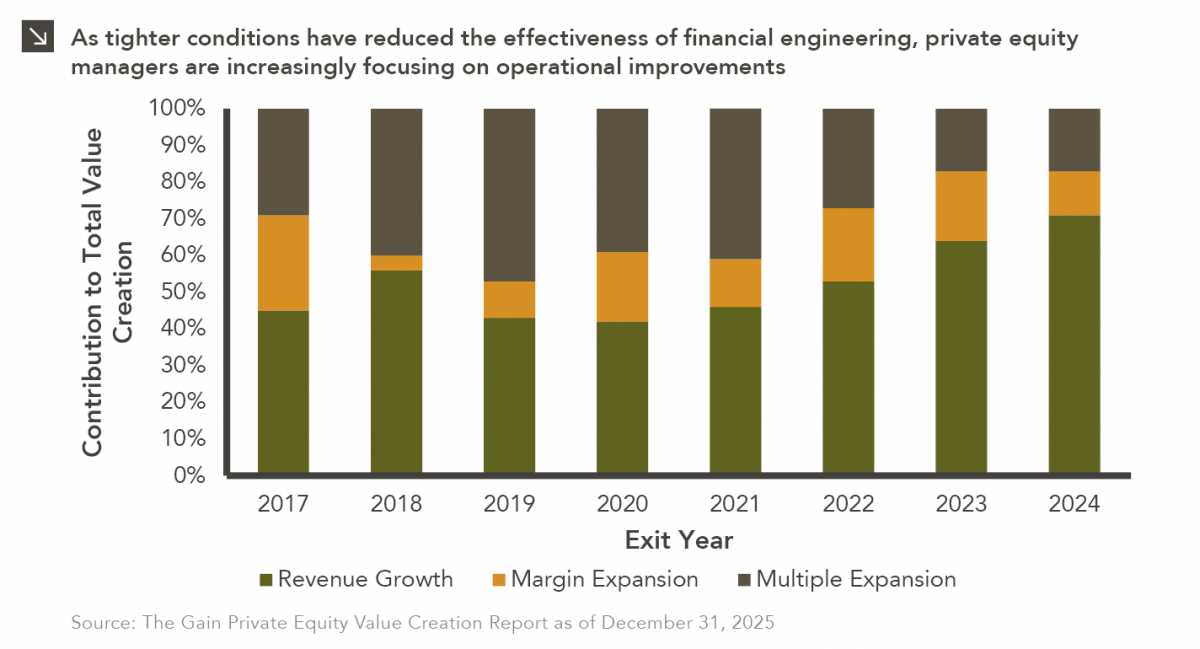
In the period between 2009 and 2022, private equity managers thrived amid an environment of low interest rates and rising asset prices, which led to financial engineering serving as a primary driver of portfolio value. In recent years, however, higher interest rates, elevated valuations, and tighter exit conditions have reduced the effectiveness of this value creation method. As a result, financial engineering has shifted from a core value driver to a supporting tool, prompting firms to increasingly focus on operational improvements within portfolio companies. Indeed, top-line growth and margin expansion are the key areas of value creation today, with revenue growth accounting for roughly 54% of value creation for deals that saw exits between 2017 and 2024. This dynamic can be attributed to the role of revenue growth as a sustainable and longer-term source of value creation, as it supports revenue base expansion, enables EBITDA growth, and facilitates more favorable valuation outcomes.

To drive both growth and profitability, private equity firms deploy a range of operational initiatives, including cost transformation, pricing optimization, technology integration, and supply chain improvements. While studies show that operations and pricing are the most effective levers in value creation playbooks, it is important to remember that execution is just as important as planning. To that point, a recent study found that more than half of executives cited poor implementation as a primary and controllable cause of underperformance of their businesses. Ultimately, as operational improvements become more crucial to value creation, private equity firms that can execute with discipline, particularly across revenue growth and margin expansion, will differentiate themselves when it comes to delivering returns and building more resilient and scalable businesses.

Print PDF

Pooja Vyas
Research Analyst

Get to Know Pooja

The opinions expressed herein are those of Marquette Associates, Inc. (“Marquette”), and are subject to change without notice. This material is not financial advice or an offer to purchase or sell any product. Marquette reserves the right to modify its current investment strategies and techniques based on changing market dynamics or client needs.

Related Content

Combination column and line chart showing increase in non-renewables and renewables in net installed capacity (GW) in columns and share of new electricity generating capacity by renewables (line) annually since 2005. Renewables ave seen a marked increase in recent years (183.95GW in 2019 to 691.94GW in 2025). Renewable Share was at 86% for 2025. For full dataset, please contact marquettemarketing@marquetteassociates.com.

05.11.2026

A Renewed Focus on Renewables

In addition to the humanitarian toll of the conflict in Iran, the world is currently confronting the impact that trade…

Stacked column chart showing Weight in S&P 500 Index in 1985, 1995, 2005, 2015, and 2025 for top 10 companies at that time, with companies stacked for each year by weight. From 1985-2015, top 10 weight ranged from 17.6% to 21.1%, but 2025's weight was 40.6%. Company makeup changes over time, with no companies from 1985/1995 categories in 2025. For full dataset, please contact marquettemarketing@marquetteassociates.com.

05.04.2026

This Too Shall Reconstitute

Rooted in medieval Persian Sufi thought, the adage “this too shall pass” speaks to the fleeting and impermanent nature of…

Three-line chart comparing cumulative returns for MSCI EM Latin America Index, MSCI EAFE Index, and S&P 500 Index, Jan 1, 2026 through April 24, 2026. Dashed line at February 28 demarcates U.S. strikes on Iran. While all three indices dipped after war began, Latin America Index was higher to begin with and remains high. Most recent data point (4/24) for Latin America is 20.36%, EAFE is 5.7%, and S&P 500 is 5.06%. For full dataset, please email marquettemarketing@marquetteassociates.com.

04.27.2026

Let’s Hear It for Latin America

Latin American equity markets have shown remarkable strength in 2026. After a strong start to the year, the MSCI Emerging…

Two-line chart showing unemployment rate for All U.S. Workers and Recent College Graduates (Ages 22–27), 12/31/05 to 12/31/25. Up to 2020 period, Recent College Graduates generally had a lower unemployment rate than all U.S. workers category, but since then, the opposite has been true. Lines begin at ~3% to ~5% range in 2005, rose during Global Financial Crisis of '07-'09 to near 10% for All, ~7% for Grads, then both lines declined fairly steadily up to COVID. Peak for both series was 6/30/20, with All at 12.8% and Grads at 13.4%. Most recent data for 12/31/25 is ~4% for All and ~5.5% for Grads. For full dataset, please email marquettemarketing@marquetteassociates.com.

04.20.2026

The Sorrows of Young Workers

Entry-level jobs have traditionally served as the primary bridge between education and stable employment, offering young workers a foothold from…

Combination column and line chart showing Net Duties Received (columns, left-hand axis, ranging $0 to $35 billion) and Effective Tariff Rate (line, right-hand axis, ranging 0 to 12%) monthly, from April 2024 through February 2025. Up to March 2025, both data series held relatively steady, averaging around $7B for net duties received, and 2% for effective tariff rate, but both series have quadrupled since then. Most recent (Feb-26) is $26B and 8%. Please contact us for the full data set at marquettemarketing@marquetteassociates.com.

04.13.2026

Liberation Day: One Year Later

On April 2, 2025, President Donald Trump announced a sweeping set of tariffs on imports into the United States. Dubbed…

Line chart showing commercial & industrial loans as percent of total bank credit since 1980. Peak of line is September 1982 at 38%; since then there has been a steady decrease, with several peaks following global crises, with February 2026 datapoint at 21%. Basel I labeled at 1988, Basel II labeled at 2004, Basel III labeled at 2010. For full dataset, please contact marquettemarketing@marquetteassociates.com.

04.06.2026

Regulation Abdication?

The Basel capital framework was created to ensure that banks maintain sufficient capital to absorb losses and reduce the risk…

More articles

Subscribe to Research Email Alerts

Research Email Alert Subscription

Research alerts keep you updated on our latest research publications. Simply enter your contact information, choose the research alerts you would like to receive and click Subscribe. Alerts will be sent as research is published.

We respect your privacy. We will never share or sell your information.

Thank You

We appreciate your interest in Marquette Associates.

If you have questions or need further information, please contact us directly and we will respond to your inquiry within 24 hours.

Contact Us >