Eddie Arrieta
Associate Research Analyst
Get to Know Eddie


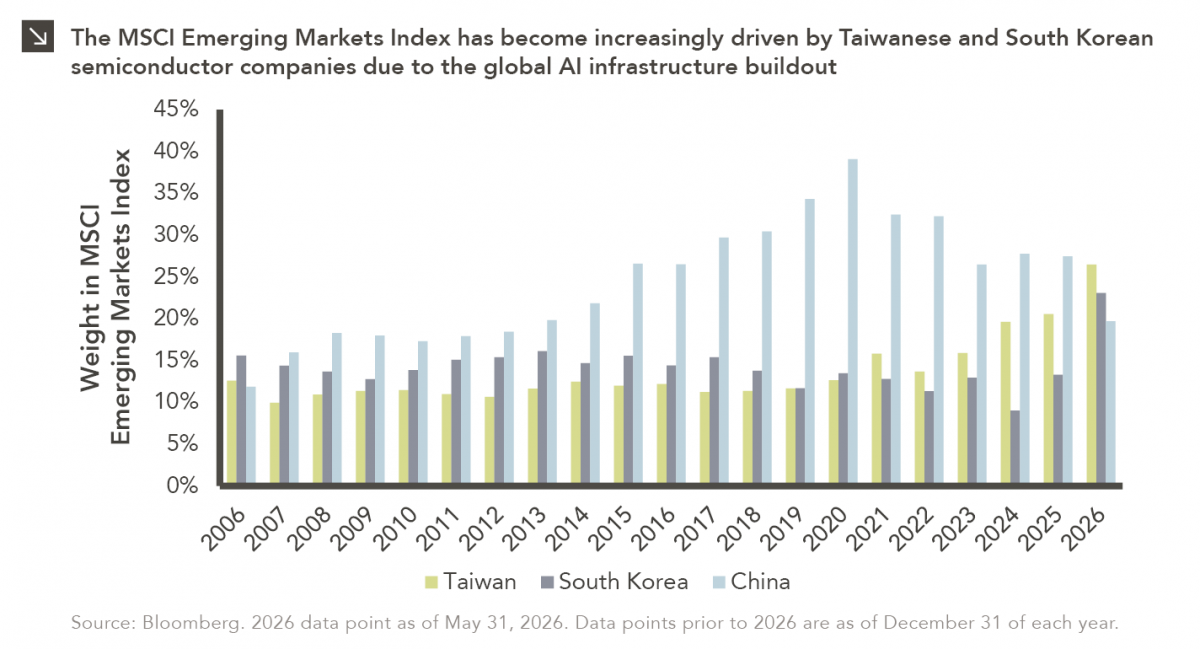
The MSCI Emerging Markets Index has undergone a significant structural transformation in recent years. For much of the past decade, China dominated the benchmark, but Taiwan now represents the largest country in the index at roughly 27%, with South Korea close behind at around 23%. After reaching nearly 40% at the end of 2020, China’s weight in the index now sits below 20%. This shift has largely been driven by the strength of Taiwan and South Korea in the semiconductor space and the global AI infrastructure buildout. For example, Taiwan Semiconductor Manufacturing Company (TSMC), the world’s leading contract chip manufacturer and a critical supplier of the advanced semiconductors used in AI accelerators, has seen its revenues, margins, and market capitalization expand significantly in the last five years. TSMC now represents nearly 15% of the MSCI Emerging Markets Index. Additionally, South Korean companies Samsung and SK Hynix have become global leaders in memory semiconductors, particularly high-bandwidth memory chips, which are essential for training and operating large AI models. Samsung and SK Hynix constitute roughly 9% and 7% of the MSCI Emerging Markets Index, respectively.
This change in index leadership carries important implications for investors. Strong performance of a relatively small group of semiconductor companies has led to an uptick in concentration within passive emerging market funds and tied benchmark performance more closely to AI-related chip demand. The lower weighting of China in the index, meanwhile, reflects both weaker relative performance for Chinese companies and the broader investor preference for markets more directly connected to AI infrastructure spending. As a result of these trends, the MSCI Emerging Markets Index increasingly reflects advanced semiconductor leadership rather than the diversified growth of emerging economies, heightening both country- and company-specific risks. For instance, geopolitical tensions involving Taiwan, supply chain disruptions, or a meaningful slowdown in AI capital expenditures could materially alter recent performance trends. This dynamic reflects a broader shift in where value creation is occurring across emerging markets and is likely to persist as long as AI-related semiconductor demand remains strong.
Print PDF
The opinions expressed herein are those of Marquette Associates, Inc. (“Marquette”), and are subject to change without notice. This material is not financial advice or an offer to purchase or sell any product. Marquette reserves the right to modify its current investment strategies and techniques based on changing market dynamics or client needs.

10.19.2026
Since 1980, the S&P 500 Index has generally performed well in the weeks surrounding U.S. midterm elections. Specifically, the index…

10.12.2026
This week’s chart highlights the accelerating growth of electricity demand in the U.S., which has been driven primarily by the…

10.08.2026
LIVE WEBINAR — OCTOBER 22 Please join Marquette’s research team for our 3Q 2026 Market Insights Webinar…

10.05.2026
For investors, the spookiest thing about October might not be the ghosts and monsters that are bound to show up…

09.28.2026
The phrase “expectations of higher inflation” has become a staple in financial news to explain the increase in nominal U.S….

09.21.2026
For much of the past several years, the conventional view has been that higher interest rates and stretched valuations would…
Research alerts keep you updated on our latest research publications. Simply enter your contact information, choose the research alerts you would like to receive and click Subscribe. Alerts will be sent as research is published.
We respect your privacy. We will never share or sell your information.
If you have questions or need further information, please contact us directly and we will respond to your inquiry within 24 hours.
Contact Us >