Chloe Ariss
Associate Research Analyst
Get to Know Chloe


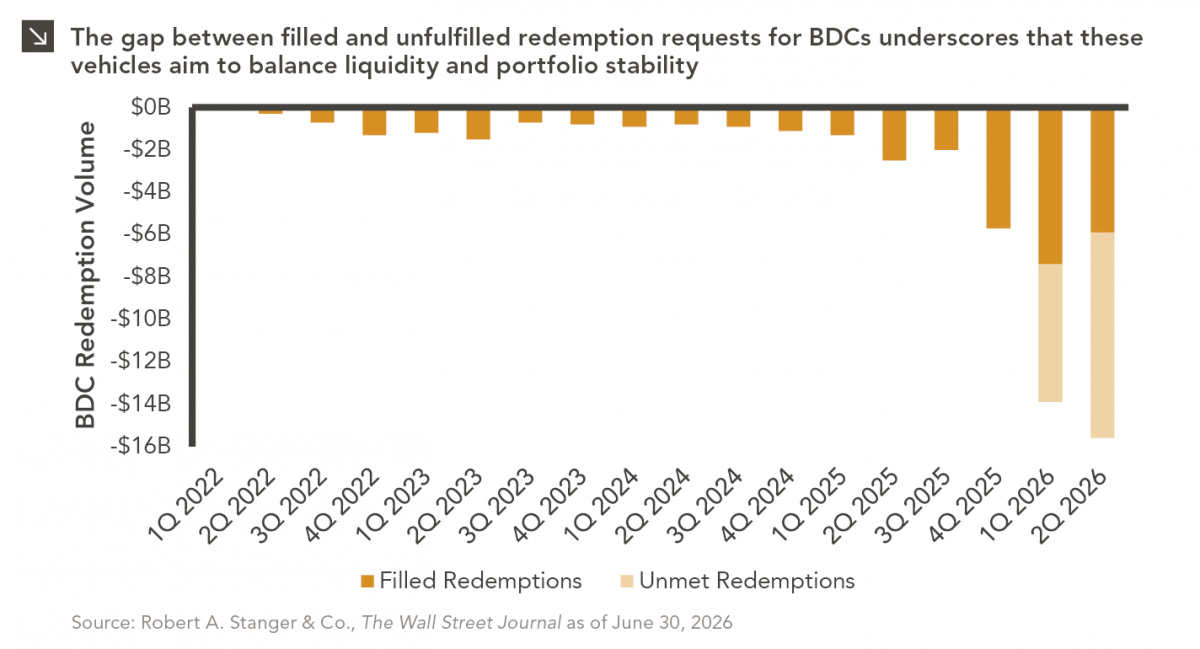
The rapid growth of non-traded business development companies (BDCs), which are investment vehicles that pool investor capital to make loans to privately held companies, has broadened access to private credit. As a result, retail investors have gained exposure to an asset class that was historically available mostly to institutional investors. However, recent redemption activity highlights a key structural consideration of the asset class: the underlying investments are inherently illiquid. Consequently, periods of elevated redemption requests can create challenges that require careful portfolio and liquidity management.
As shown in this week’s chart, redemption volumes remained relatively muted from 2022 through the third quarter of last year, then accelerated over recent quarters. Indeed, redemption requests now exceed the amount that BDCs are required to fulfill (5% of assets), resulting in a growing level of unfilled redemptions. While this may appear concerning at first glance, redemption limits are a key feature of non-traded BDC structures and are intended to protect the remaining investors in the fund from forced selling of illiquid assets. In many cases, unmet redemption requests reflect the operation of these safeguards as designed, rather than an indication of any deterioration in portfolio quality. While there are signs that BDC redemption requests may have peaked, it is likely that redemptions will remain elevated in the coming quarters as the non-traded BDCs work through queues based on underlying liquidity.
This trend also highlights a key distinction between publicly traded and non-traded BDCs. Publicly traded BDCs provide daily liquidity via the secondary market, with discounts and premiums to NAV reflecting changes in investor sentiment. In contrast, non-traded BDCs generally seek to maintain a more stable NAV, instead relying on repurchase programs and redemption limits to manage liquidity. The recent widening of discounts among publicly traded BDCs may also be contributing to redemption activity in non-traded vehicles, as public vehicles can be viewed as relatively attractive from a valuation perspective.
It is important to note that continued redemption pressures could have an impact on portfolio construction. Managers may hold additional cash, utilize additional fund-level leverage, or slow deployment to preserve liquidity, potentially reducing exposure to newly originated investments and leaving portfolios more concentrated in older vintage loans. For investors, the widening gap between filled and unfilled redemption requests is a reminder that private credit was not designed to function as a daily liquid asset class. Non-traded BDCs can provide valuable access to private markets for certain investors, but liquidity ultimately remains constrained by the underlying assets. As a result, investors should carefully consider whether a semi-liquid structure aligns with their needs and objectives. Manager selection also remains a critical consideration in this space, as approaches to portfolio construction, valuation, liquidity management, and performance can vary meaningfully across strategies.
Print PDF
The opinions expressed herein are those of Marquette Associates, Inc. (“Marquette”), and are subject to change without notice. This material is not financial advice or an offer to purchase or sell any product. Marquette reserves the right to modify its current investment strategies and techniques based on changing market dynamics or client needs.

10.12.2026
This week’s chart highlights the accelerating growth of electricity demand in the U.S., which has been driven primarily by the…

10.08.2026
LIVE WEBINAR — OCTOBER 22 Please join Marquette’s research team for our 3Q 2026 Market Insights Webinar…

10.05.2026
For investors, the spookiest thing about October might not be the ghosts and monsters that are bound to show up…

09.28.2026
The phrase “expectations of higher inflation” has become a staple in financial news to explain the increase in nominal U.S….

09.21.2026
For much of the past several years, the conventional view has been that higher interest rates and stretched valuations would…

09.14.2026
There are many great things about working at Marquette Associates, but “Free Lunch Tuesday” is right at the top of…
Research alerts keep you updated on our latest research publications. Simply enter your contact information, choose the research alerts you would like to receive and click Subscribe. Alerts will be sent as research is published.
We respect your privacy. We will never share or sell your information.
If you have questions or need further information, please contact us directly and we will respond to your inquiry within 24 hours.
Contact Us >