Dennis Yu
Research Analyst


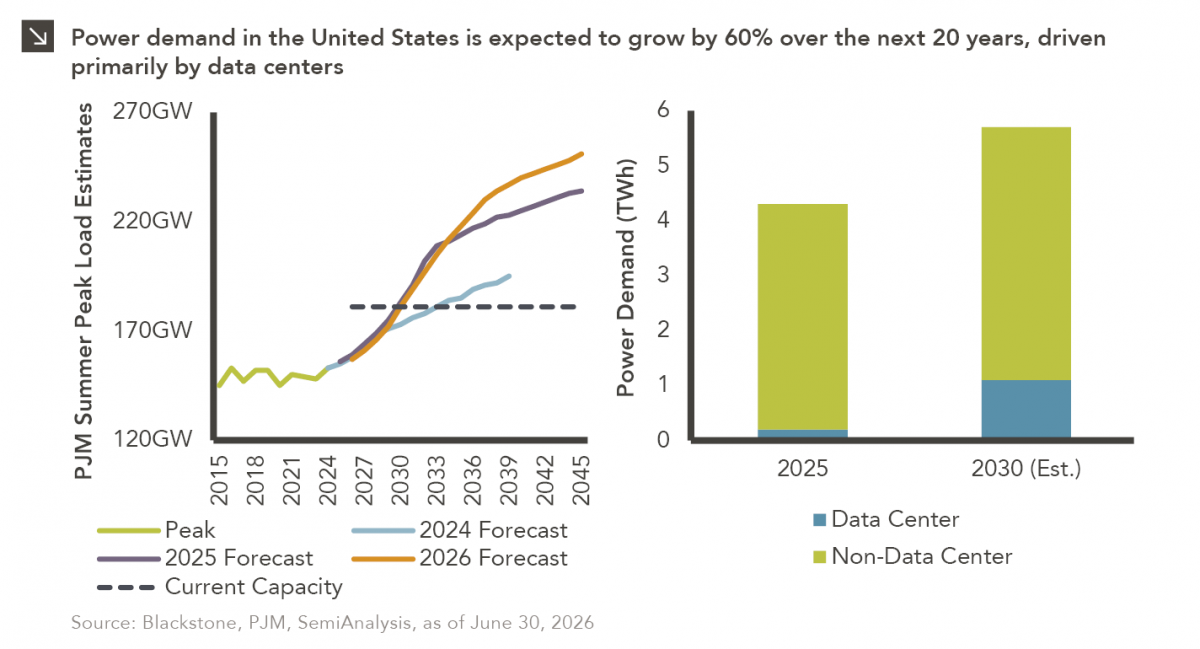
This week’s chart highlights the accelerating growth of electricity demand in the U.S., which has been driven primarily by the rapid expansion of data centers and increasing adoption of artificial intelligence. Specifically, U.S. power consumption is projected to rise from approximately 4.4 TWh in 2025 to 5.7 TWh by 2030, with data centers accounting for a significant portion of this increase. This trend is particularly evident in the PJM electricity market, where peak load is now forecast to reach 251 GW by 2046, significantly exceeding the 181 GW of current capacity. For context, the PJM Interconnection is the regional wholesale electricity market serving all or parts of 13 states and the District of Columbia, while peak load represents the highest level of electricity demand at a given time. The widening gap between projected peak demand and available capacity highlights the need for substantial investment in new generation, transmission, and storage infrastructure to maintain grid reliability and meet growing electricity needs. Further, successive upward revisions to demand forecasts underscore the magnitude of anticipated electricity needs and the growing pressure on existing power infrastructure.
This widening gap between projected demand and available capacity is creating a substantial investment opportunity across the broader energy infrastructure ecosystem. Beyond data center development, significant capital will be required to expand power generation, modernize transmission and distribution networks, and deploy energy storage solutions to support grid reliability. For infrastructure investors, these trends present opportunities across both traditional and emerging sectors, including regulated utilities, contracted power generation, renewable energy, and battery storage. While the scale of investment needs is significant, execution risks related to permitting, grid interconnection, construction timelines, and regulatory frameworks remain important considerations. Core and core-plus infrastructure strategies may be particularly well positioned to benefit from this structural demand growth through long-duration assets supported by regulated or contracted cash flows.
Print PDF
The opinions expressed herein are those of Marquette Associates, Inc. (“Marquette”), and are subject to change without notice. This material is not financial advice or an offer to purchase or sell any product. Marquette reserves the right to modify its current investment strategies and techniques based on changing market dynamics or client needs.
11.16.2026
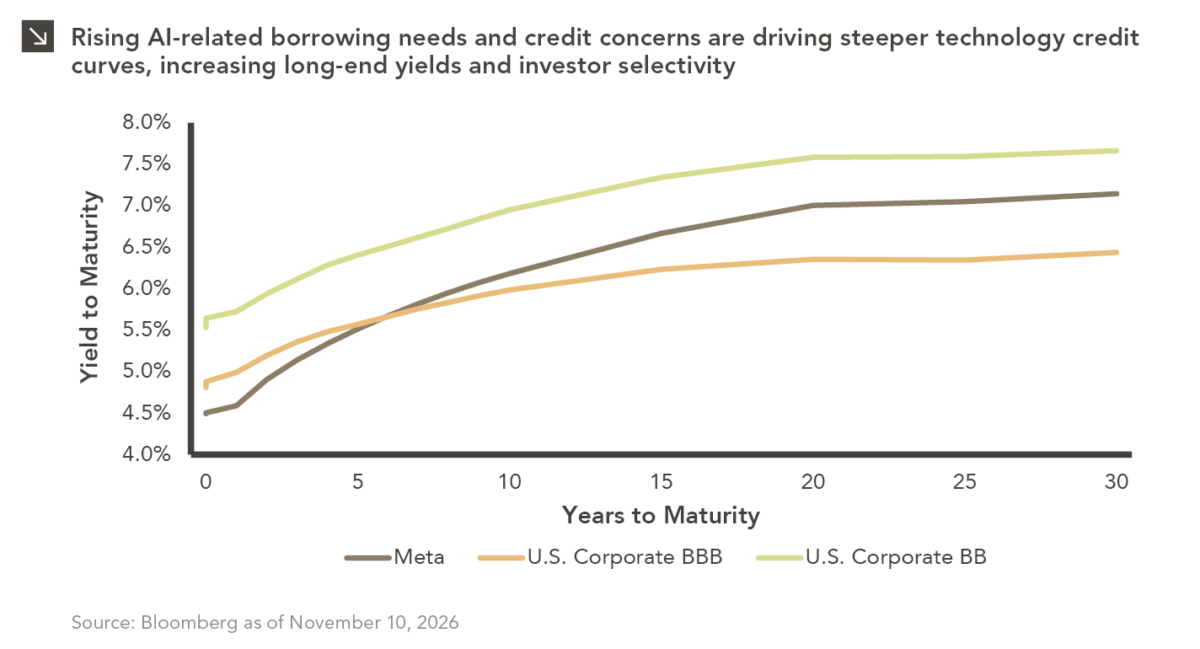
Corporate bond spreads are not homogeneous, meaning they are rarely consistent across the yield curve. For instance, the Meta curve…

11.09.2026
The U.S. distressed debt market is showing increasingly pronounced signs of stress. As of this writing, option-adjusted spreads on CCC-rated…

11.02.2026
Emerging markets faced a challenging October, with the space declining by around 8.3% amid renewed concerns over the sustainability of…

10.26.2026
Private equity activity is increasingly shifting toward smaller transactions, with total deal value for transactions of $100 million or less…

10.08.2026
This video is a recording of a live webinar held October 22 by Marquette’s research team analyzing the third quarter…

10.19.2026
Since 1980, the S&P 500 Index has generally performed well in the weeks surrounding U.S. midterm elections. Specifically, the index…
Research alerts keep you updated on our latest research publications. Simply enter your contact information, choose the research alerts you would like to receive and click Subscribe. Alerts will be sent as research is published.
We respect your privacy. We will never share or sell your information.
If you have questions or need further information, please contact us directly and we will respond to your inquiry within 24 hours.
Contact Us >