Eddie Arrieta
Associate Research Analyst
Get to Know Eddie


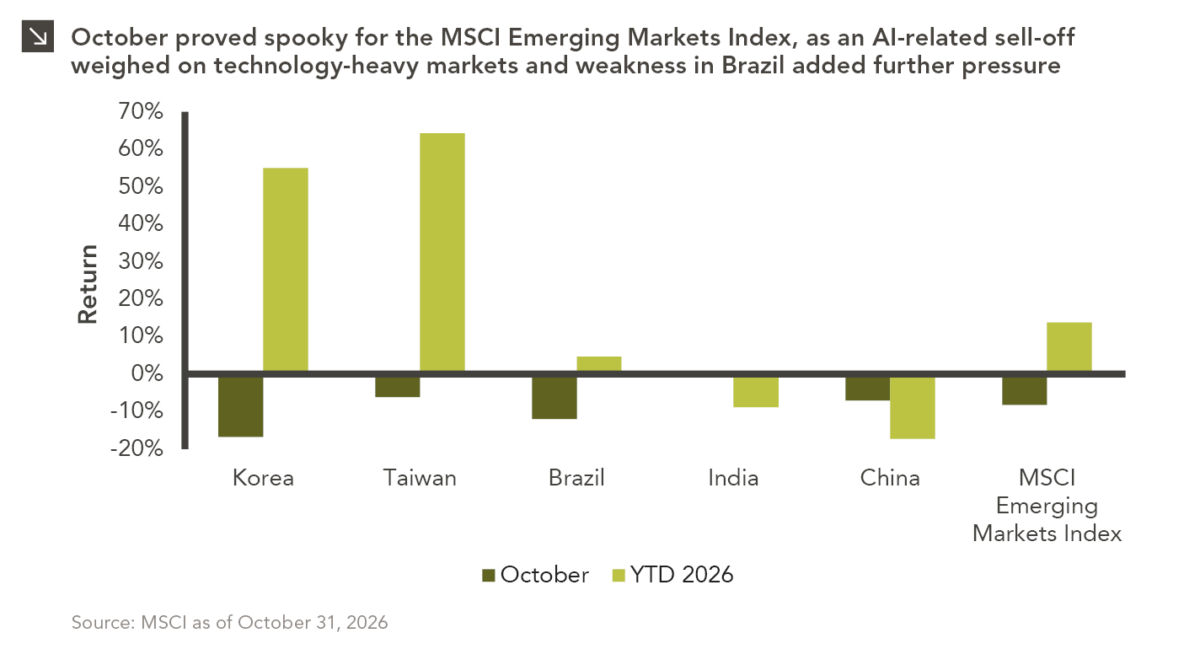
Emerging markets faced a challenging October, with the space declining by around 8.3% amid renewed concerns over the sustainability of AI-related investment and elevated technology valuations. These factors weighed particularly heavily on semiconductor-oriented markets, with the MSCI Korea and Taiwan indices falling by roughly 16.8% and 6.2% during the month, respectively, reversing some of the strong gains notched by these countries earlier in the year. Brazilian stocks have also struggled in recent weeks, with the country’s index falling by approximately 12.0% after an unexpected presidential runoff outcome reversed earlier market optimism and renewed concerns about the country’s fiscal outlook. Indian stocks, which have been laggards within emerging markets on a year-to-date basis, proved relatively resilient with a modest 0.3% gain in October. These dynamics are reflected in the above chart.
This sell-off intensified following disappointing U.S. technology earnings, which raised further questions about whether the substantial capital being invested in artificial intelligence will ultimately translate into adequate shareholder value. Weakness in Google, Amazon, and Intel added to concerns about the scale of investment required to support AI infrastructure and the timing of potential returns. These concerns spilled into Asian semiconductor markets, placing additional pressure on Korea and Taiwan, where technology companies have been major contributors to equity market performance. However, the recent pullback does not necessarily signal a deterioration in the industry’s underlying fundamentals. To that point, Asian semiconductor suppliers continue to report strong demand related to AI, suggesting that the market’s reaction may reflect a reassessment of valuations, capital spending requirements, and expected returns rather than a fundamental weakening in demand. Nevertheless, the heavy concentration of recent market gains in technology-related companies leaves these markets particularly sensitive to changes in investor sentiment.
Brazil faced a separate, country-specific shock in October following the reelection of left-wing incumbent President Luiz Inácio Lula da Silva, who defeated right-wing challenger Flávio Bolsonaro. The result reversed market optimism that had developed following Bolsonaro’s strong first-round performance, when investors anticipated a potential shift toward a more market-oriented administration focused on fiscal consolidation, spending restraint, and pro-business reforms. Instead, Lula’s victory raised concerns that government spending and social programs will remain a priority, complicating efforts to stabilize public finances and reduce Brazil’s substantial debt burden. Brazilian equities fell sharply following the result, while the real weakened and government bond yields rose as investors reassessed the country’s fiscal outlook and unwound positions established ahead of the election. The primary concern for investors is whether Lula’s administration can balance its social spending commitments with the need to contain government debt. Brazil’s public debt already exceeds 80% of GDP, and elevated interest costs leave the government with limited fiscal flexibility. Although Lula has maintained an existing fiscal framework intended to constrain spending growth, investors remain concerned that additional social programs, public investment, and other spending commitments could outpace revenue growth. A sustained deterioration in fiscal credibility could keep borrowing costs elevated, increase pressure on the Brazilian real, and weigh on equity valuations, particularly among domestically oriented companies that are sensitive to interest rates and economic growth.
Finally, India has been comparatively insulated from the semiconductor-led sell-off that impacted other Asian markets given its more limited exposure to the AI-related rally. That said, its relative resilience should be viewed in the context of ongoing challenges, including elevated oil prices and continued foreign investor outflows. Higher oil prices are particularly relevant for India as a major energy importer, potentially pressuring corporate margins, inflation, and the country’s trade balance.
The divergence between these countries illustrates how performance within emerging markets continues to be driven by a combination of global risk sentiment, sector composition, and region-specific developments rather than a single theme. Looking ahead, the sustainability of AI-related investment and the returns generated by that spending will remain important drivers of emerging market performance, particularly for Korea and Taiwan. Continued strength in semiconductor demand could support a recovery if investors regain confidence in the industry’s earnings outlook, although elevated valuations and questions surrounding the profitability of AI investment may contribute to further volatility. Performance of Brazilian stocks will likely remain sensitive to developments surrounding fiscal policy and investor confidence, while the trajectory of oil prices and foreign capital flows should have an outsized impact on Indian equities. Overall, October’s pullback highlights the considerable dispersion beneath the surface of emerging markets and the risks associated with concentrated market leadership. While the strongest markets continue to post substantial gains for the year, the recent sell-off has narrowed their performance advantage and underscored the importance of diversification and distinguishing between markets benefiting from strong structural growth trends and those facing more persistent economic or political headwinds.
Print PDF
The opinions expressed herein are those of Marquette Associates, Inc. (“Marquette”), and are subject to change without notice. This material is not financial advice or an offer to purchase or sell any product. Marquette reserves the right to modify its current investment strategies and techniques based on changing market dynamics or client needs.
10.26.2026
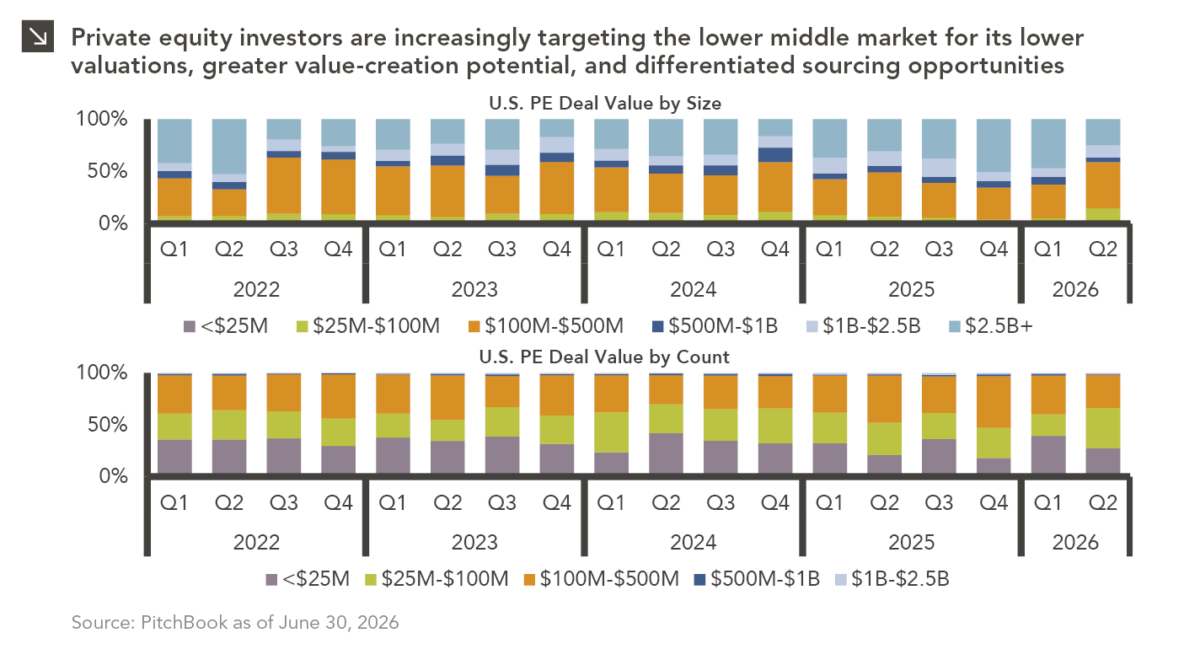
Private equity activity is increasingly shifting toward smaller transactions, with total deal value for transactions of $100 million or less…

10.08.2026
This video is a recording of a live webinar held October 22 by Marquette’s research team analyzing the third quarter…

10.22.2026
Anyone who has run a marathon knows the last six miles are brutal — no matter how well the first…
10.19.2026
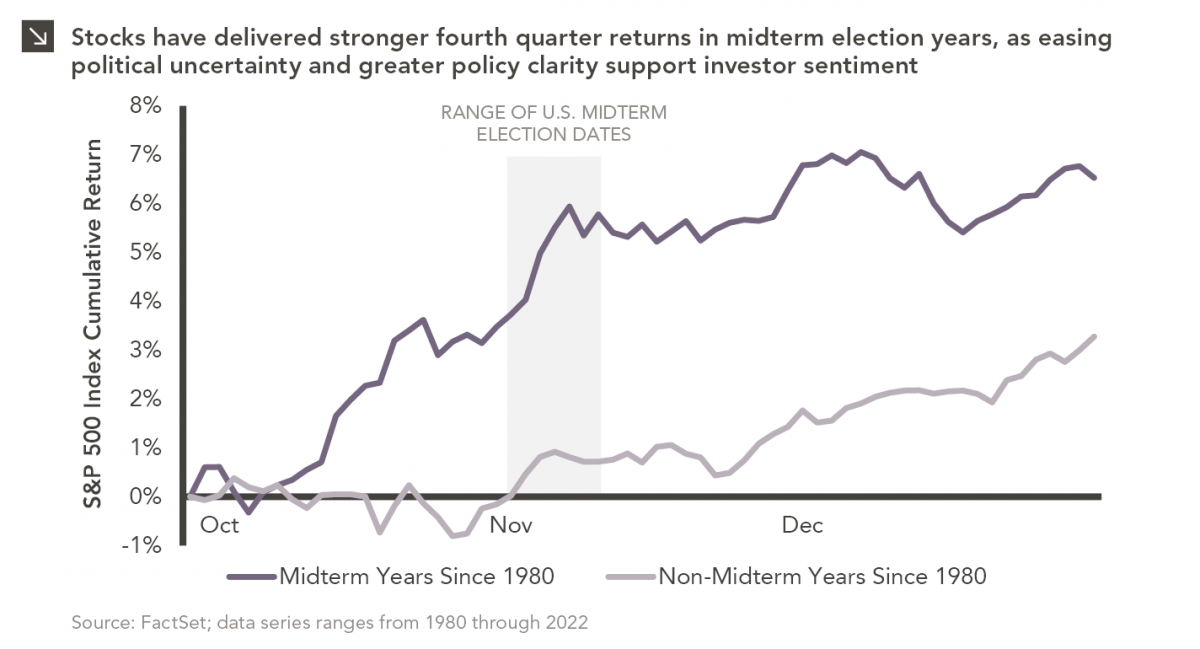
Since 1980, the S&P 500 Index has generally performed well in the weeks surrounding U.S. midterm elections. Specifically, the index…
10.12.2026
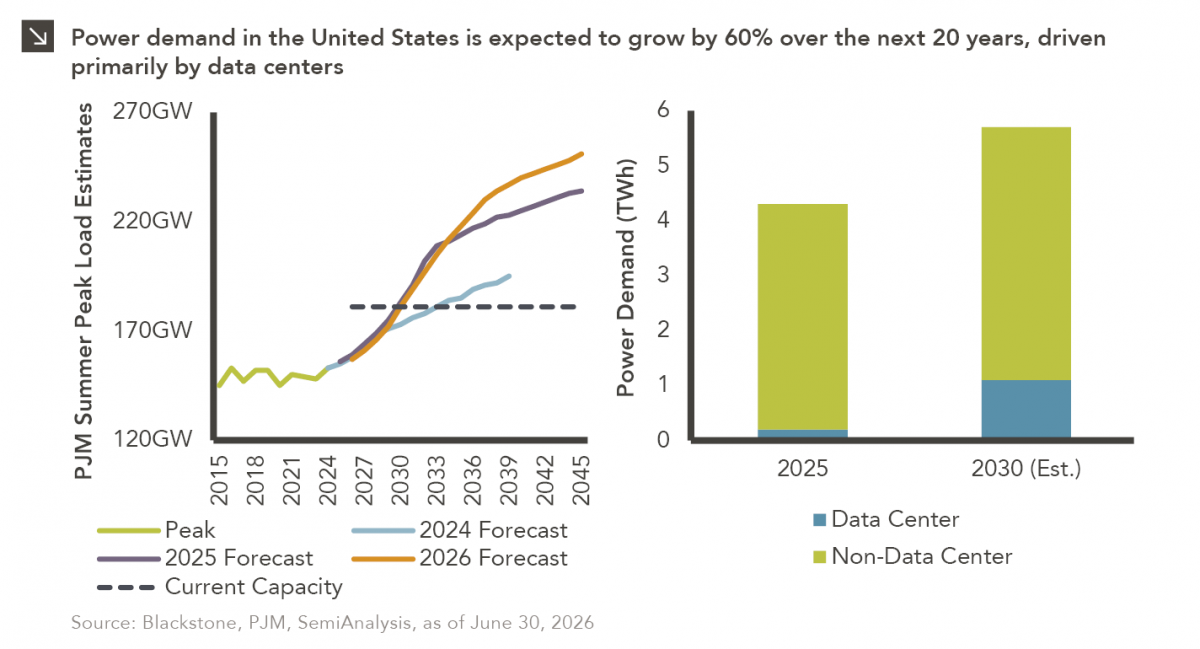
This week’s chart highlights the accelerating growth of electricity demand in the U.S., which has been driven primarily by the…
10.05.2026
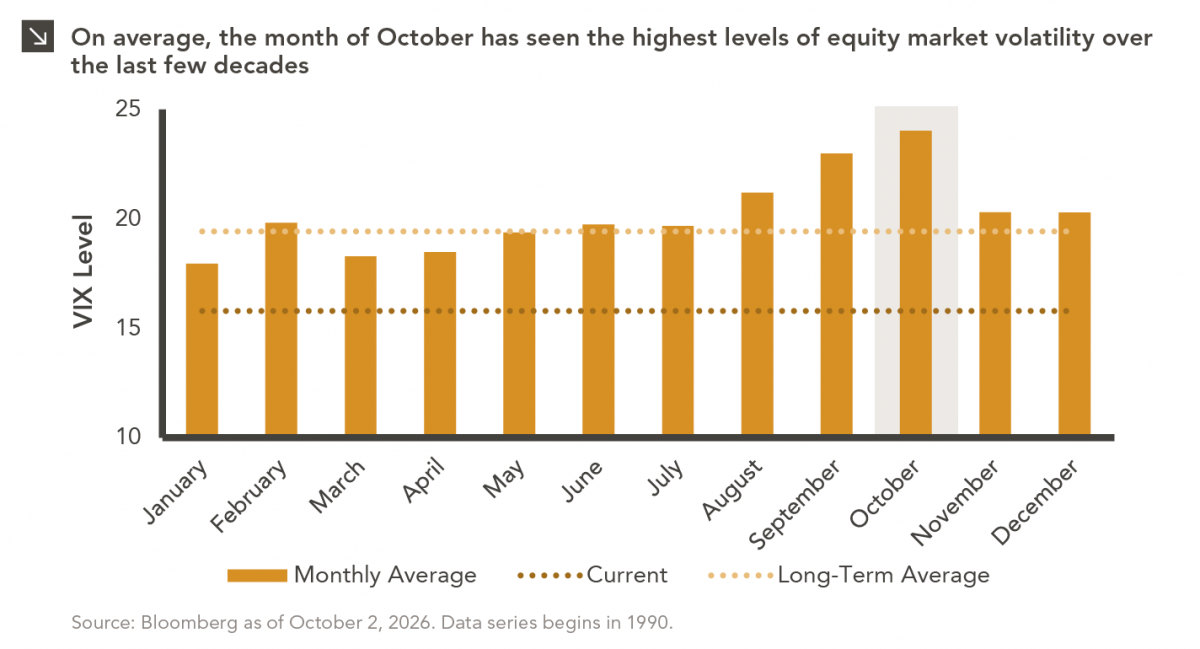
For investors, the spookiest thing about October might not be the ghosts and monsters that are bound to show up…
Research alerts keep you updated on our latest research publications. Simply enter your contact information, choose the research alerts you would like to receive and click Subscribe. Alerts will be sent as research is published.
We respect your privacy. We will never share or sell your information.
If you have questions or need further information, please contact us directly and we will respond to your inquiry within 24 hours.
Contact Us >