Will Higher Rates Cramp the Markets?

October 22, 2026 | Greg Leonberger, FSA, EA, MAAA, FCA, Partner, Director of Research

Anyone who has run a marathon knows the last six miles are brutal — no matter how well the first 20 miles went, it’s really about how each runner can handle the cramps and pain of the remaining course. The outcome tends to be rather binary — it’s either the worst running experience of someone’s life (mine) or when the strongest push through and finish strong (one of our research colleagues in this year’s Chicago marathon).

This year’s market feels similar. Through September 30, most stock indices are headed for their fourth consecutive year of double-digit returns, but the massive run-up of rates in the third quarter reminds us how quickly markets can change. Nothing will be final until we cross the finish line on December 31.

Read > Will Higher Rates Cramp the Markets?

Greg Leonberger, FSA, EA, MAAA, FCA
Partner, Director of Research

Get to Know Greg

The opinions expressed herein are those of Marquette Associates, Inc. (“Marquette”), and are subject to change without notice. This material is not financial advice or an offer to purchase or sell any product. Marquette reserves the right to modify its current investment strategies and techniques based on changing market dynamics or client needs.
Related Content

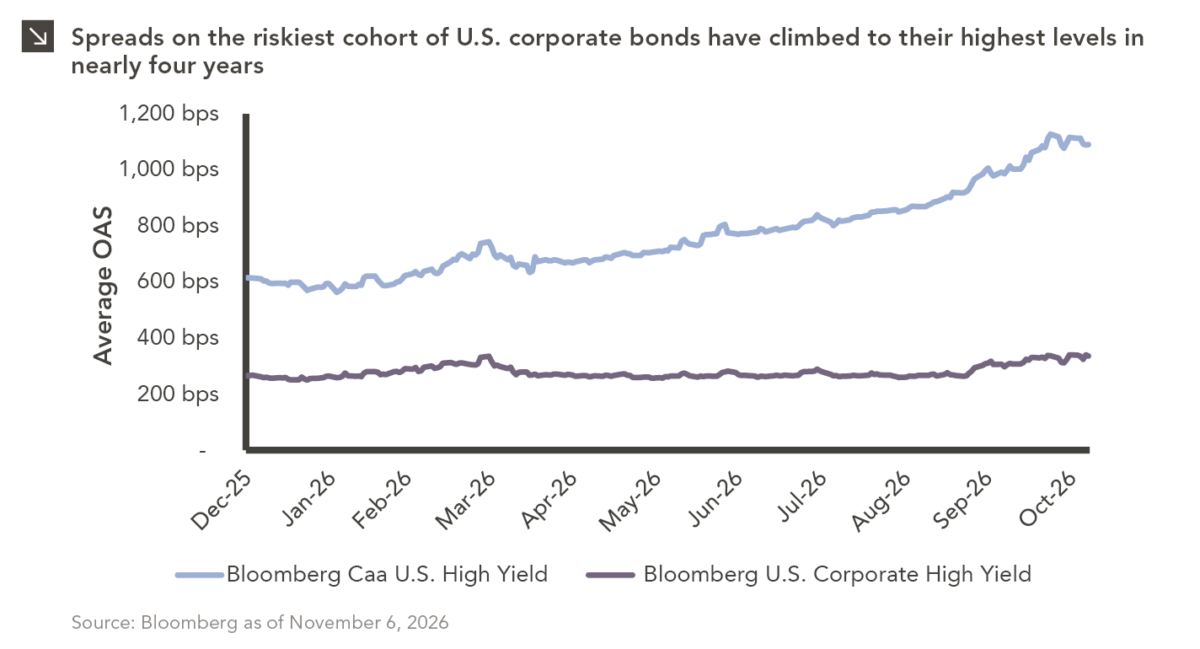
Line chart showing average option-adjusted spreads (OAS), in basis points, on Bloomberg CCC U.S. High Yield and Bloomberg U.S. Corporate High Yield bonds from December 2025 through October 2026. CCC-rated high yield spreads increased from approximately 600 bps to 1,100 bps, reaching their highest levels in nearly four years, while broader U.S. corporate high yield spreads remained relatively stable, increasing from approximately 260 bps to 330 bps. Source: Bloomberg as of November 6, 2026. For full dataset, please contact marquettemarketing@marquetteassociates.com.

11.09.2026

C’s Get Degrees (of Pain)

The U.S. distressed debt market is showing increasingly pronounced signs of stress. As of this writing, option-adjusted spreads on CCC-rated…
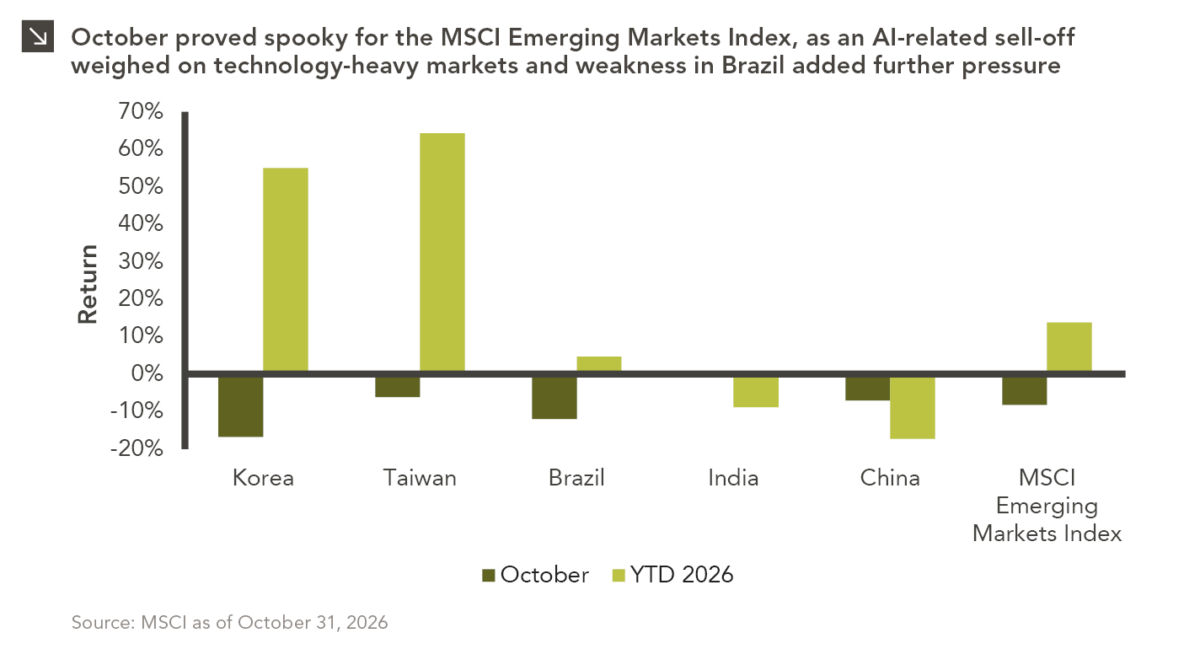
Bar chart comparing October and year-to-date 2026 returns for Korea, Taiwan, Brazil, India, China, and the MSCI Emerging Markets Index. October returns are below zero for most markets, while year-to-date returns range from negative to positive. For full dataset, please contact marquettemarketing@marquetteassociates.com.

11.02.2026

The Haunting of Emerging Markets

Emerging markets faced a challenging October, with the space declining by around 8.3% amid renewed concerns over the sustainability of…
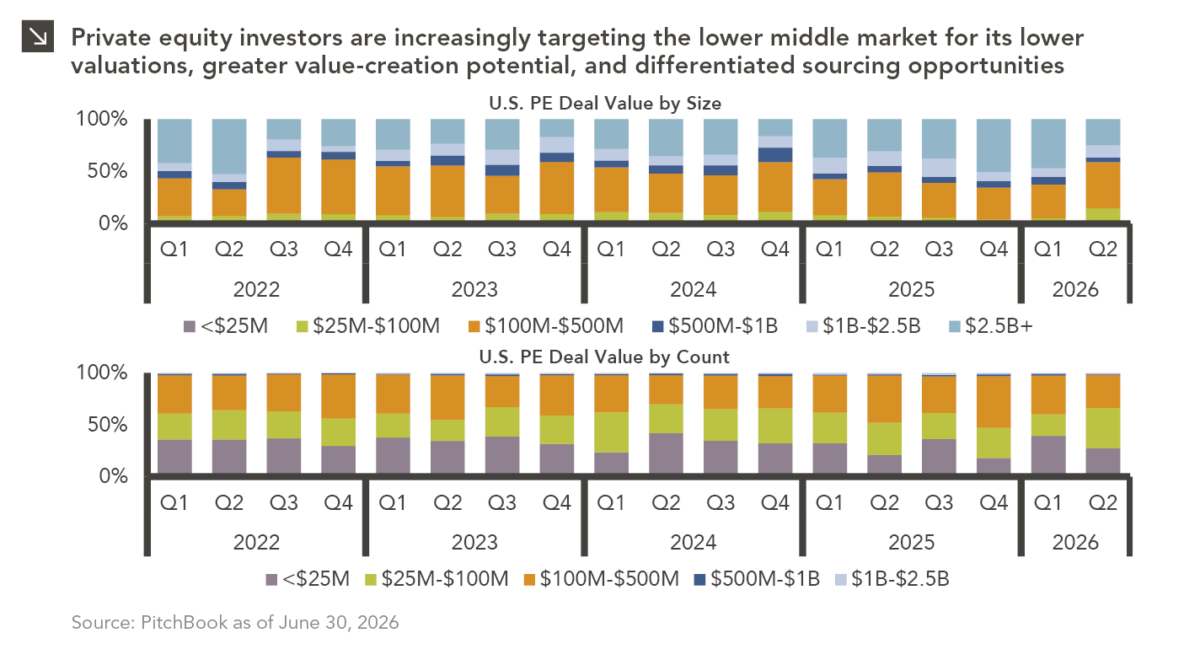
Stacked bar chart showing U.S. private equity deal value by deal size from Q1 2022 through Q2 2026. The y-axis shows percentage of total deal value from 0% to 100%, and the x-axis shows quarters by year. Stacked bar chart showing the percentage of U.S. private equity deal count by deal size from Q1 2022 through Q2 2026. The y-axis ranges from 0% to 100%, and the x-axis shows quarters by year. For full dataset, please contact marquettemarketing@marquetteassociates.com.

10.26.2026

Smaller Deals, Larger Appeal

Private equity activity is increasingly shifting toward smaller transactions, with total deal value for transactions of $100 million or less…

10.08.2026

3Q 2026 Market Insights

This video is a recording of a live webinar held October 22 by Marquette’s research team analyzing the third quarter…
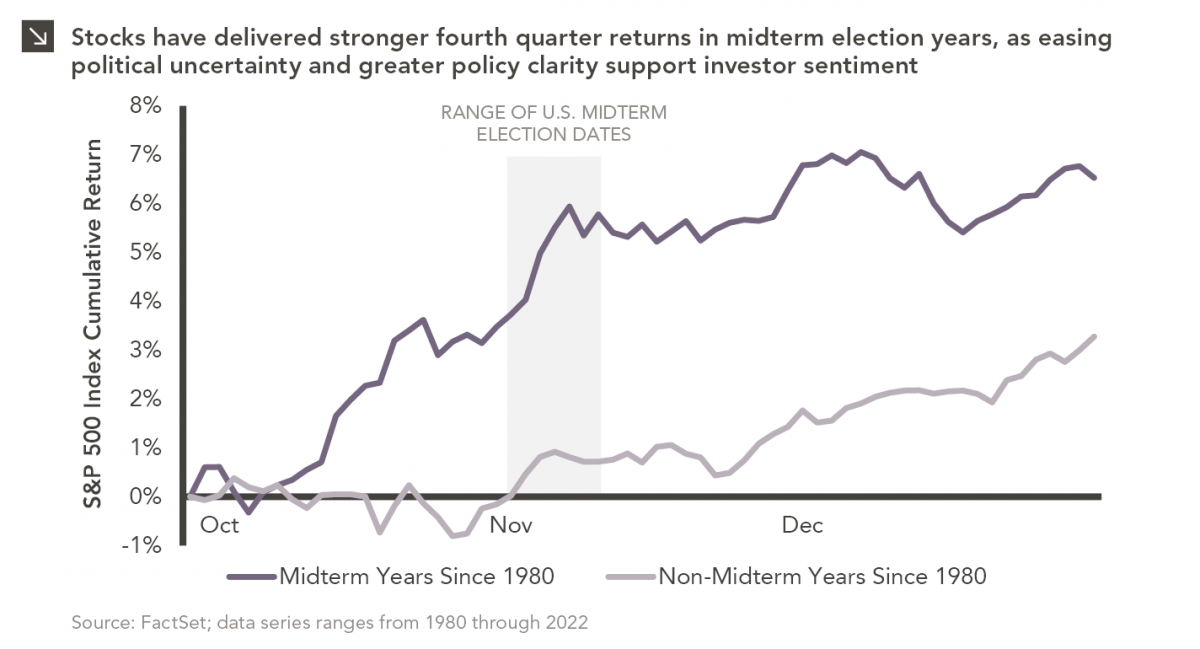
Line chart comparing S&P 500 Index cumulative returns for midterm and non-midterm election years since 1980. The x-axis shows October through December, and the y-axis shows S&P 500 Index cumulative return, ranging from -1% to 8%. For full dataset, please contact marquettemarketing@marquetteassociates.com.

10.19.2026

Divided We Rise?

Since 1980, the S&P 500 Index has generally performed well in the weeks surrounding U.S. midterm elections. Specifically, the index…
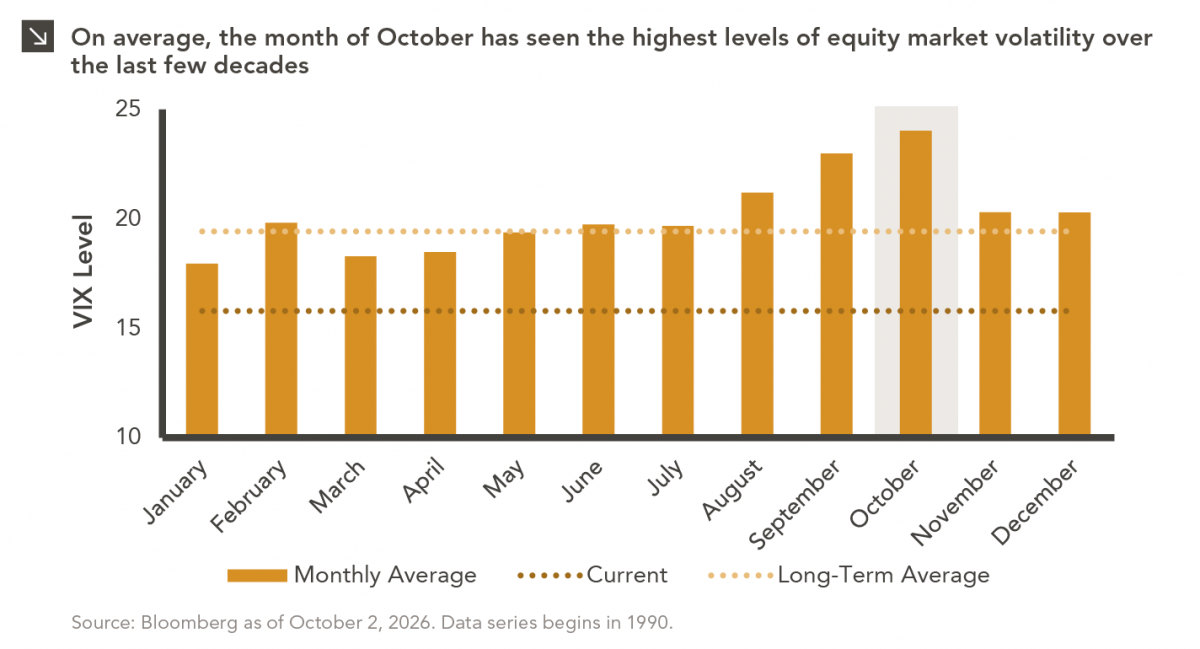
Bar chart showing average monthly VIX levels from 1990 through October 2026. The x-axis displays months of the year from January through December, and the y-axis displays VIX level. October has the highest average VIX level among all months, while April has the lowest. The chart also includes a current VIX level and a long-term average VIX level for comparison. Source: Bloomberg as of October 2, 2026. Data series begins in 1990. For full dataset, please contact marquettemarketing@marquetteassociates.com.

10.05.2026

Spooky Season

For investors, the spookiest thing about October might not be the ghosts and monsters that are bound to show up…

More articles

Subscribe to Research Email Alerts

Research Email Alert Subscription

Research alerts keep you updated on our latest research publications. Simply enter your contact information, choose the research alerts you would like to receive and click Subscribe. Alerts will be sent as research is published.

We respect your privacy. We will never share or sell your information.

Thank You

We appreciate your interest in Marquette Associates.

If you have questions or need further information, please contact us directly and we will respond to your inquiry within 24 hours.

Contact Us >