Pooja Vyas
Research Analyst



Private equity activity is increasingly shifting toward smaller transactions, with total deal value for transactions of $100 million or less increasing by nearly 60% in the second quarter (on a quarter-over-quarter basis). By comparison, deal value declined by more than 31% and 63% for transactions in the $100 million to $1 billion range and for deals above $1 billion, respectively, over the same period. Deal count fell across all three size categories in the second quarter, but smaller transactions proved more resilient. To that point, total deal count for transactions below $100 million declined by around 7% in the second quarter, compared with declines of 29% for deals between $100 million and $1 billion and 21% for deals above $1 billion.
This shift toward smaller deals comes as private equity firms are experiencing higher entry valuations and a challenging exit environment. Indeed, larger, more scaled businesses are continuing to command premium valuations, in part because fewer sponsors are seeking to exit these assets. This limits the supply of attractive platforms available for sale. Additionally, larger and more mature companies offer fewer opportunities for significant growth or margin improvement, placing greater importance on entry valuations and eventual exit multiples as they relate to realized returns. Conversely, smaller businesses typically trade at more attractive valuations and can offer numerous ways for sponsors to create value, as these companies often have opportunities to grow through acquisitions, operational improvements, professionalization, and expansion into new products or markets. In many cases, private equity firms are also the first institutional investors in these businesses, giving sponsors an opportunity to invest before many of these growth and operational initiatives have been fully implemented.
The valuation gap between these two ends of the market has become increasingly pronounced. As of the end of the first quarter, the median entry multiple for companies valued between $500 million and $1 billion reached more than 13x EV/EBITDA, up from around 12x in 2025. Comparatively, the median multiple for companies valued between $25 million and $100 million declined by roughly 4% over the same period and now sits at just above 8x. Higher interest rates and tighter debt markets have contributed to this divide, making large, highly leveraged buyouts more expensive and increasingly difficult to underwrite.
Investor preferences are also beginning to reflect these dynamics. In addition to the benefits of lower entry valuations and greater potential for operational improvement, limited partners are increasingly favoring sector-specialist managers over generalists and looking further down the market. Lower-middle-market firms can leverage deep industry expertise and established networks to source differentiated opportunities within their target sectors, including proprietary or less intermediated transactions that may be less accessible through broader auction processes. Looking ahead, the lower middle market will likely remain an important area of focus for both sponsors and limited partners. If elevated valuations, higher financing costs, and exit challenges persist, the ability of funds to initiate positions at more attractive valuations and generate returns via company-specific growth and operational improvements will become increasingly important.
Print PDF
The opinions expressed herein are those of Marquette Associates, Inc. (“Marquette”), and are subject to change without notice. This material is not financial advice or an offer to purchase or sell any product. Marquette reserves the right to modify its current investment strategies and techniques based on changing market dynamics or client needs.
11.16.2026
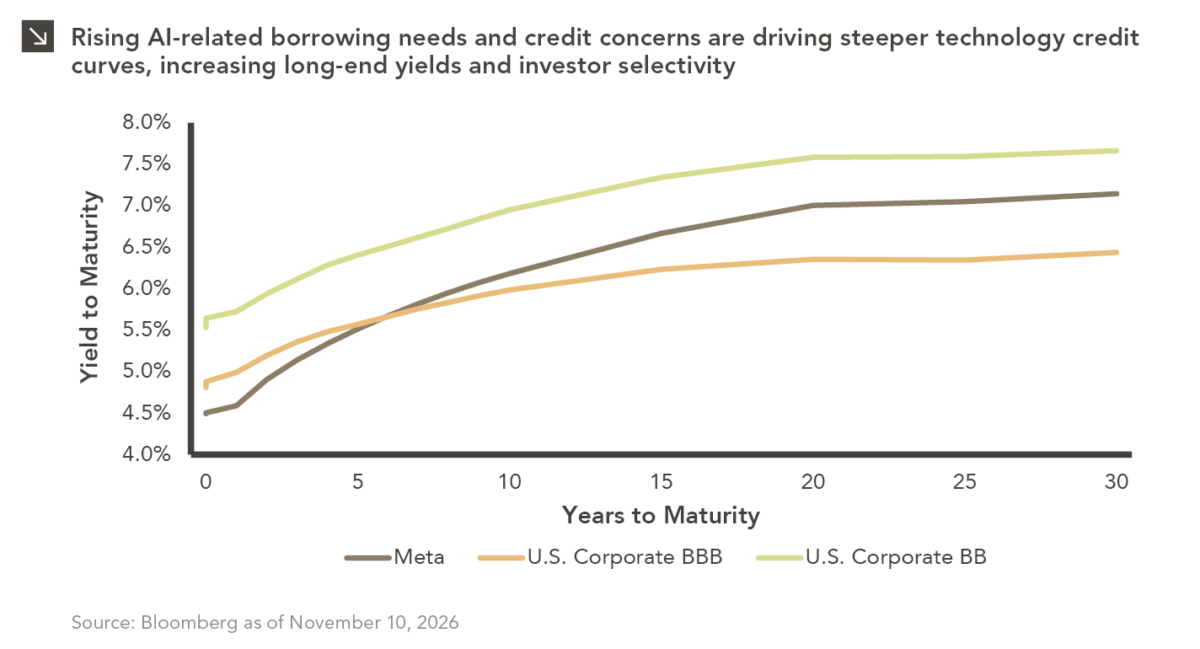
Corporate bond spreads are not homogeneous, meaning they are rarely consistent across the yield curve. For instance, the Meta curve…

11.09.2026
The U.S. distressed debt market is showing increasingly pronounced signs of stress. As of this writing, option-adjusted spreads on CCC-rated…

11.02.2026
Emerging markets faced a challenging October, with the space declining by around 8.3% amid renewed concerns over the sustainability of…

10.08.2026
This video is a recording of a live webinar held October 22 by Marquette’s research team analyzing the third quarter…

10.22.2026
Anyone who has run a marathon knows the last six miles are brutal — no matter how well the first…

10.19.2026
Since 1980, the S&P 500 Index has generally performed well in the weeks surrounding U.S. midterm elections. Specifically, the index…
Research alerts keep you updated on our latest research publications. Simply enter your contact information, choose the research alerts you would like to receive and click Subscribe. Alerts will be sent as research is published.
We respect your privacy. We will never share or sell your information.
If you have questions or need further information, please contact us directly and we will respond to your inquiry within 24 hours.
Contact Us >