Divided We Rise?

October 19, 2026 | Fred Huang, Research Analyst

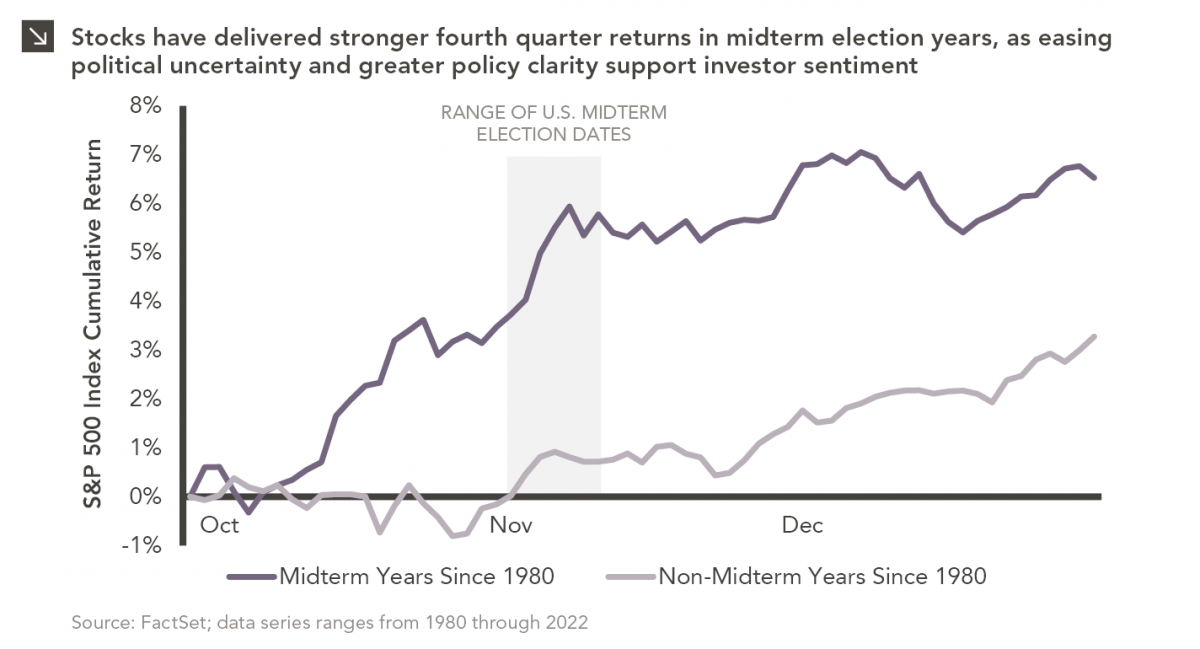
Line chart comparing S&P 500 Index cumulative returns for midterm and non-midterm election years since 1980. The x-axis shows October through December, and the y-axis shows S&P 500 Index cumulative return, ranging from -1% to 8%. For full dataset, please contact marquettemarketing@marquetteassociates.com.

Since 1980, the S&P 500 Index has generally performed well in the weeks surrounding U.S. midterm elections. Specifically, the index has notched an average return of approximately 6.5% in the fourth quarter of midterm election years, compared with roughly 3.0% in the fourth quarter of all other years.

Why do stocks tend to perform well following midterm elections?

  • Markets often experience uncertainty ahead of elections, with a recovery sometimes beginning in the days leading up to Election Day. Once the outcome of the election becomes clearer, the range of potential policy outcomes narrows, reducing uncertainty and potentially supporting equity valuations. Historically, this pattern has occurred regardless of which party gains or loses control of Congress.
  • The incumbent president’s party has lost seats in 36 of the last 39 midterm elections. A divided government can limit the likelihood of sweeping policy changes, providing investors with greater visibility into the regulatory and fiscal environment. Major changes to corporate taxes, capital gains treatment, healthcare, financial regulation, and energy policy often require congressional support. Although a divided government can constrain both pro-growth measures and policies that may weigh on corporate profitability, markets may benefit from greater predictability and a narrower range of potential outcomes.
  • Administrations may pursue more difficult or politically contentious measures earlier in a presidential term, while placing greater emphasis on pro-growth policies and economic stimulus as the next presidential election approaches. This dynamic can contribute to a more supportive policy environment for equities later in the presidential cycle.

Does this suggest stocks will rally following next month’s midterm elections?
Historical evidence points to a favorable seasonal tendency for U.S. equities following midterm elections, particularly over the subsequent two to three months. However, this pattern should be viewed as a supportive factor rather than a standalone investment signal. A more compelling outlook would combine favorable election-related seasonality with improving earnings expectations, reasonable valuations, and supportive monetary policy. Of these four factors, at least two currently appear to be in place, providing a potentially constructive backdrop for U.S. equities, although historical patterns do not guarantee positive returns.

Print PDF

Fred Huang
Research Analyst

Get to Know Fred

The opinions expressed herein are those of Marquette Associates, Inc. (“Marquette”), and are subject to change without notice. This material is not financial advice or an offer to purchase or sell any product. Marquette reserves the right to modify its current investment strategies and techniques based on changing market dynamics or client needs.
Related Content

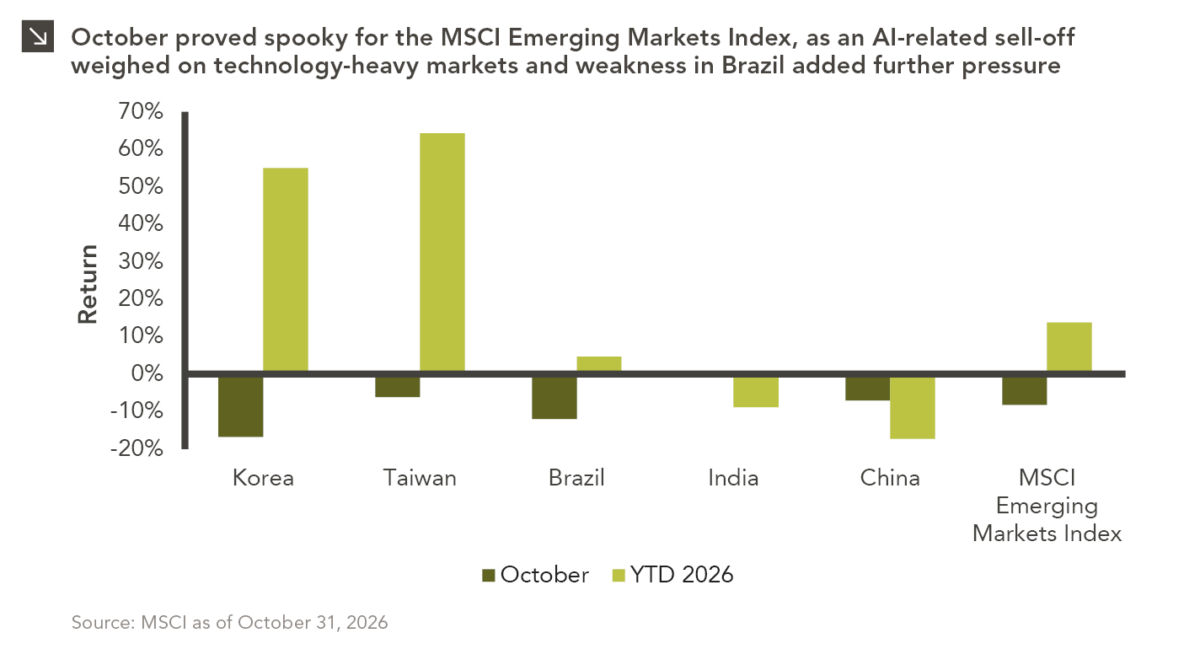
Bar chart comparing October and year-to-date 2026 returns for Korea, Taiwan, Brazil, India, China, and the MSCI Emerging Markets Index. October returns are below zero for most markets, while year-to-date returns range from negative to positive. For full dataset, please contact marquettemarketing@marquetteassociates.com.

11.02.2026

The Haunting of Emerging Markets

Emerging markets faced a challenging October, with the space declining by around 8.3% amid renewed concerns over the sustainability of…
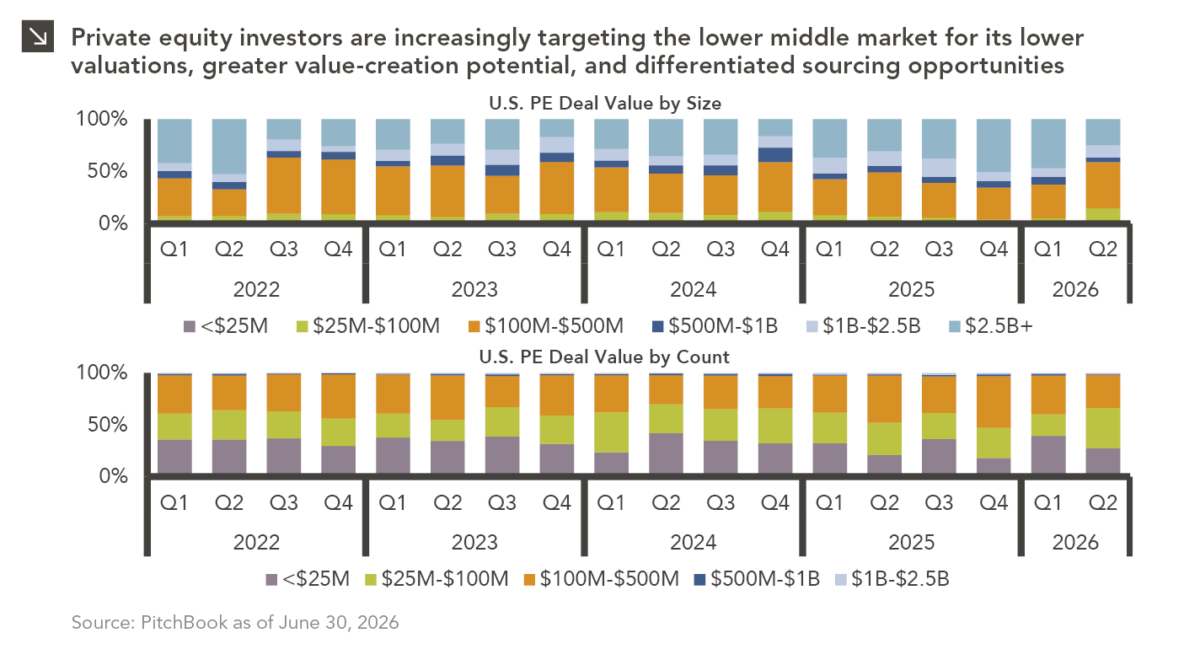
Stacked bar chart showing U.S. private equity deal value by deal size from Q1 2022 through Q2 2026. The y-axis shows percentage of total deal value from 0% to 100%, and the x-axis shows quarters by year. Stacked bar chart showing the percentage of U.S. private equity deal count by deal size from Q1 2022 through Q2 2026. The y-axis ranges from 0% to 100%, and the x-axis shows quarters by year. For full dataset, please contact marquettemarketing@marquetteassociates.com.

10.26.2026

Smaller Deals, Larger Appeal

Private equity activity is increasingly shifting toward smaller transactions, with total deal value for transactions of $100 million or less…

10.08.2026

3Q 2026 Market Insights

This video is a recording of a live webinar held October 22 by Marquette’s research team analyzing the third quarter…

10.22.2026

Will Higher Rates Cramp the Markets?

Anyone who has run a marathon knows the last six miles are brutal — no matter how well the first…
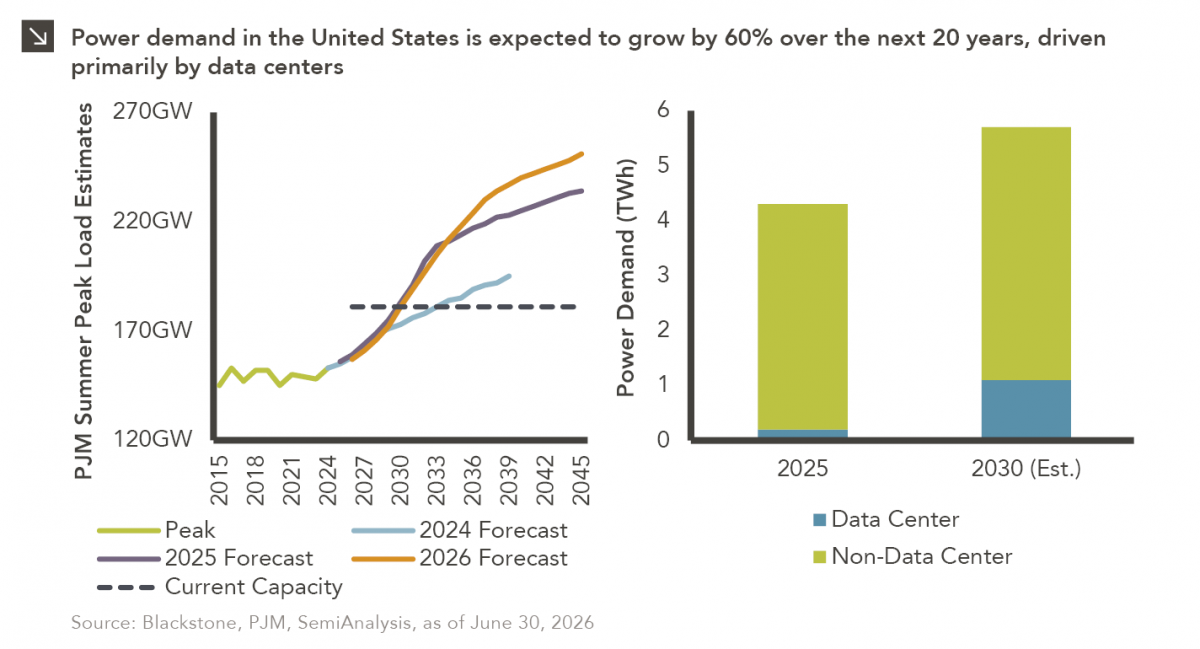
Chart #1 - Line chart showing PJM summer peak load estimates in gigawatts (GW) from 2015 to 2045. The chart compares historical peak load, current capacity, and forecasts from 2024, 2025, and 2026, showing projected demand rising above current capacity over time. Chart #2 - Stacked bar chart showing U.S. power demand in terawatt-hours (TWh) for 2025 and estimated demand in 2030. The chart compares data center and non-data center demand, showing total power demand increasing over the period.

10.12.2026

The Power Demand Supercycle

This week’s chart highlights the accelerating growth of electricity demand in the U.S., which has been driven primarily by the…
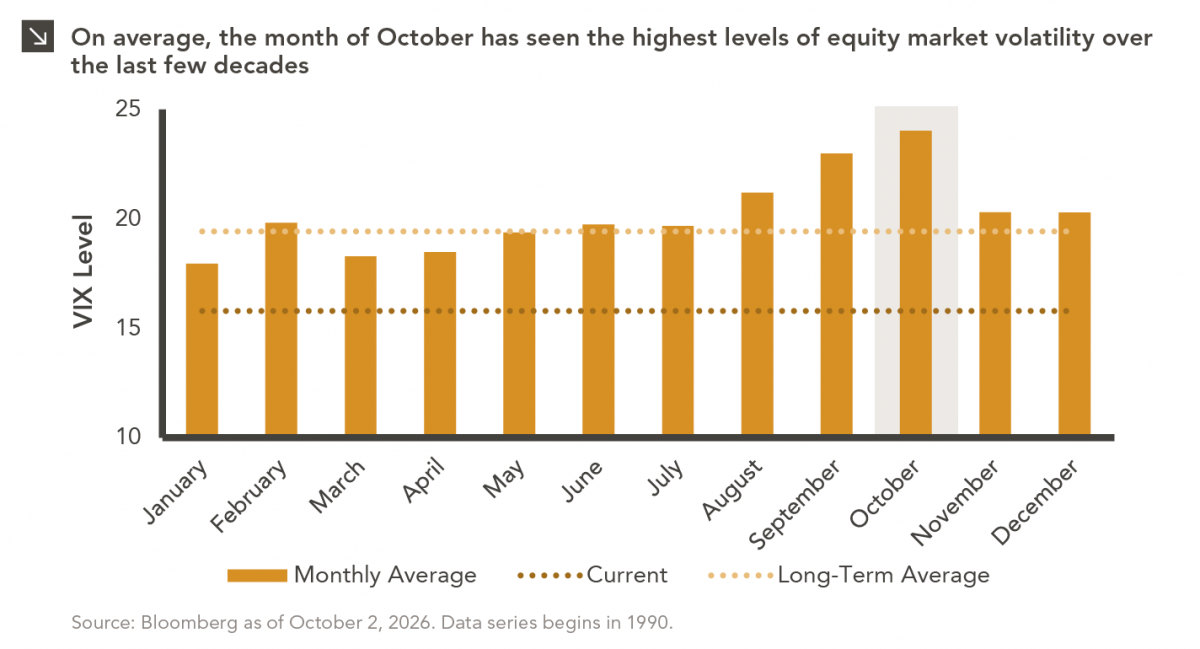
Bar chart showing average monthly VIX levels from 1990 through October 2026. The x-axis displays months of the year from January through December, and the y-axis displays VIX level. October has the highest average VIX level among all months, while April has the lowest. The chart also includes a current VIX level and a long-term average VIX level for comparison. Source: Bloomberg as of October 2, 2026. Data series begins in 1990. For full dataset, please contact marquettemarketing@marquetteassociates.com.

10.05.2026

Spooky Season

For investors, the spookiest thing about October might not be the ghosts and monsters that are bound to show up…

More articles

Subscribe to Research Email Alerts

Research Email Alert Subscription

Research alerts keep you updated on our latest research publications. Simply enter your contact information, choose the research alerts you would like to receive and click Subscribe. Alerts will be sent as research is published.

We respect your privacy. We will never share or sell your information.

Thank You

We appreciate your interest in Marquette Associates.

If you have questions or need further information, please contact us directly and we will respond to your inquiry within 24 hours.

Contact Us >