Weston Whalen, CFA
Associate Research Analyst
Get to Know Weston


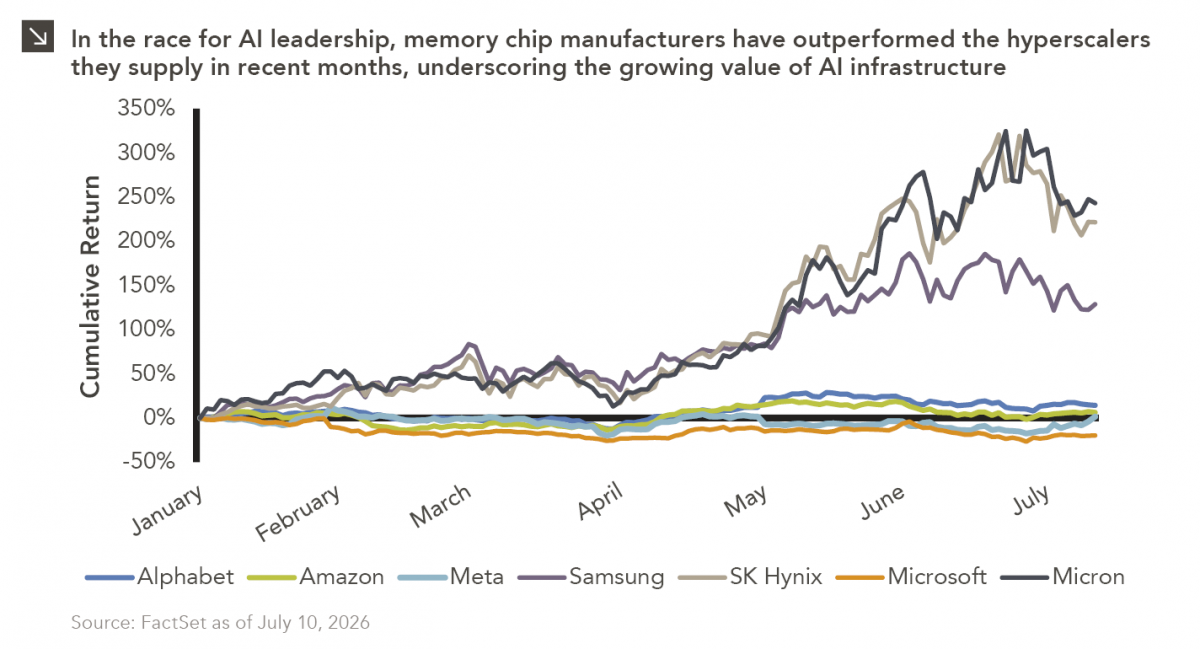
One of the enduring lessons of the California Gold Rush is that the greatest fortunes were often made not by the prospectors themselves, but by the businesses that supplied them with the essential “picks and shovels” needed in their pursuit of gold. As companies such as OpenAI, Anthropic, Alphabet, and others compete to develop increasingly sophisticated large language models, demand for the memory chips and semiconductors that power these technologies has surged, providing a significant tailwind for hardware manufacturers. The surge in demand for AI infrastructure has propelled memory chip manufacturers to record valuations. In 2026, SK Hynix, Samsung, and U.S.-based Micron each surpassed a $1 trillion market capitalization as memory has become one of the industry’s most valuable and sought-after commodities. Collectively, these three companies are now worth more than Saudi Aramco, Exxon Mobil, and Chevron (the world’s three largest oil companies), highlighting the extraordinary value investors are placing on the AI supply chain.
Microsoft, Meta, Amazon, and Alphabet are expected to spend more than $670 billion on AI-related capital expenditures in 2026, up from a combined $410 billion in 2025. This surge in investment has fueled unprecedented demand for memory chips, prompting Samsung and SK Hynix to commit more than $500 billion to expand semiconductor manufacturing capacity in South Korea. As investors continue to assess the winners and losers of the AI race, memory chip and semiconductor manufacturers have emerged as some of the market’s strongest performers.
Print PDF
The opinions expressed herein are those of Marquette Associates, Inc. (“Marquette”), and are subject to change without notice. This material is not financial advice or an offer to purchase or sell any product. Marquette reserves the right to modify its current investment strategies and techniques based on changing market dynamics or client needs.

10.08.2026
This video is a recording of a live webinar held October 22 by Marquette’s research team analyzing the third quarter…

10.22.2026
Anyone who has run a marathon knows the last six miles are brutal — no matter how well the first…

10.19.2026
Since 1980, the S&P 500 Index has generally performed well in the weeks surrounding U.S. midterm elections. Specifically, the index…

10.12.2026
This week’s chart highlights the accelerating growth of electricity demand in the U.S., which has been driven primarily by the…

10.05.2026
For investors, the spookiest thing about October might not be the ghosts and monsters that are bound to show up…

09.28.2026
The phrase “expectations of higher inflation” has become a staple in financial news to explain the increase in nominal U.S….
Research alerts keep you updated on our latest research publications. Simply enter your contact information, choose the research alerts you would like to receive and click Subscribe. Alerts will be sent as research is published.
We respect your privacy. We will never share or sell your information.
If you have questions or need further information, please contact us directly and we will respond to your inquiry within 24 hours.
Contact Us >