Dennis Yu
Research Analyst


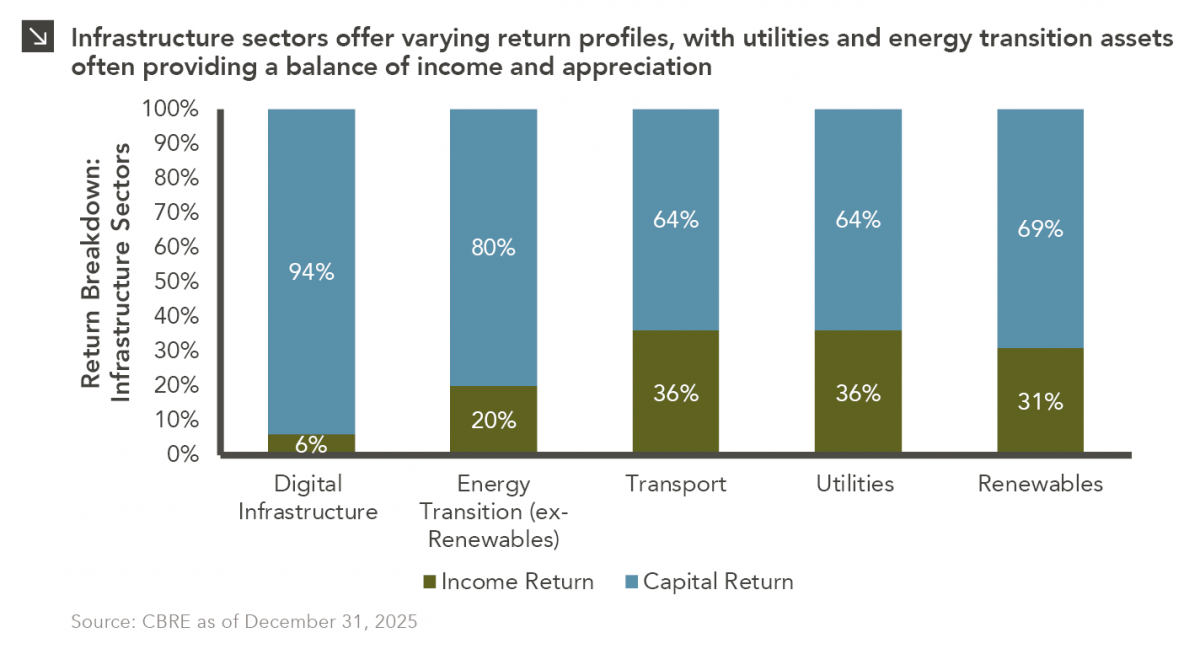
This week’s chart highlights the varying return profiles across key infrastructure sectors by illustrating the split between income and capital appreciation. Digital infrastructure stands out given the extent to which total returns are driven primarily by capital gains with minimal contributions from current income. This reflects strong investor demand for data center platforms, where development pipelines continue to expand rapidly alongside accelerating AI adoption, cloud computing growth, and increasing data consumption. However, elevated entry valuations and ambitious growth assumptions are leading to a wider range of potential investment outcomes for this space as capital markets test the sustainability of current expectations.
In contrast, energy transition sectors, renewables, utilities, and transportation assets exhibit a more balanced profile, with a larger portion of returns generated via recurring cash flows and contracted revenues. As the buildout of data center capacity intensifies, significant investment will also be required in the infrastructure needed to power these facilities. This dynamic is creating attractive opportunities in adjacent sectors including renewable generation, battery energy storage, and grid modernization. While these investments may not offer the same headline return potential as digital infrastructure, they often benefit from long-term contracted cash flows, multiple pathways to value creation, and return characteristics that may be more suitable for core and core-plus infrastructure investors seeking durable income and downside protection.
Print PDF
The opinions expressed herein are those of Marquette Associates, Inc. (“Marquette”), and are subject to change without notice. This material is not financial advice or an offer to purchase or sell any product. Marquette reserves the right to modify its current investment strategies and techniques based on changing market dynamics or client needs.

10.19.2026
Since 1980, the S&P 500 Index has generally performed well in the weeks surrounding U.S. midterm elections. Specifically, the index…

10.12.2026
This week’s chart highlights the accelerating growth of electricity demand in the U.S., which has been driven primarily by the…

10.08.2026
LIVE WEBINAR — OCTOBER 22 Please join Marquette’s research team for our 3Q 2026 Market Insights Webinar…

10.05.2026
For investors, the spookiest thing about October might not be the ghosts and monsters that are bound to show up…

09.28.2026
The phrase “expectations of higher inflation” has become a staple in financial news to explain the increase in nominal U.S….

09.21.2026
For much of the past several years, the conventional view has been that higher interest rates and stretched valuations would…
Research alerts keep you updated on our latest research publications. Simply enter your contact information, choose the research alerts you would like to receive and click Subscribe. Alerts will be sent as research is published.
We respect your privacy. We will never share or sell your information.
If you have questions or need further information, please contact us directly and we will respond to your inquiry within 24 hours.
Contact Us >