Frank Valle, CFA, CAIA
Associate Director of Fixed Income


In the cinematic masterpiece Rocky IV, Rocky gets dazed by his opponent, Captain Ivan Drago, and complains that he sees “three of him out there.” In response, Rocky’s cornerman famously quips back “Hit the one in the middle!” In addition to being terrific boxing wisdom, this quote may also be sound advice for Federal Reserve Chairman Kevin Warsh as it relates to how the central bank should navigate increasingly divergent views on the appropriate path for interest rates.
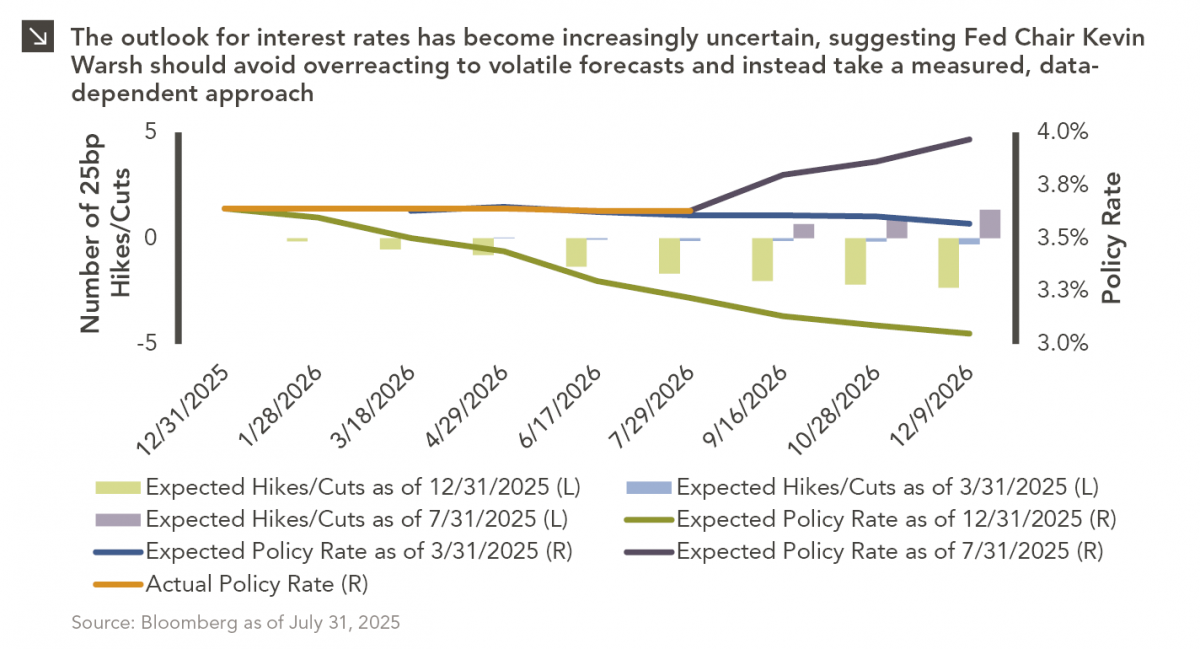
Market expectations of future rate policy have shifted significantly since the start of the year, with Wall Street traders whipsawing between projections for cuts and hikes. Coming into 2026, markets expected inflation to continue to moderate alongside a weakening labor market, creating a backdrop in which investors anticipated that the Federal Reserve would have greater flexibility to ease monetary policy and gradually lower interest rates over the course of the year. Specifically, on December 31, 2025, investors were pricing in around two rate cuts in 2026 (and a corresponding implied federal funds rate of roughly 3.1% by year-end). That outlook began to deteriorate in March as the war in Iran and subsequent closure of the Strait of Hormuz heightened inflation concerns, causing markets to price out those expected rate cuts. This shift continued through the spring and into the summer, with markets at one point pricing a meaningful probability of two rate hikes by year-end ahead of last week’s Federal Open Market Committee meeting. The Fed ultimately left rates unchanged in July, and market expectations subsequently moderated to one hike for the remainder of this year and an implied federal funds rate of approximately 4.0% at year-end.
It is important to note that the Federal Reserve has its own outlook for interest rates. Historically, the Fed has communicated this outlook via the “dot plot” contained in its Summary of Economic Projections, although that framework may soon be modified as part of a broader move away from explicit forward guidance, as the newly installed Warsh has expressed a preference for a reduction in forward guidance. That said, the dot plot released in June, which is the most recently available, indicated that nearly half of Fed officials saw a potential rate increase before year-end. This marked a meaningful shift from March, when none of the policymakers in the survey anticipated a hike in 2026 and the median forecast still called for a rate cut. The latest median projection now shows no expected easing in 2026, indicating that policymakers have become more cautious about cutting rates as persistent inflation remains a concern.
Readers should note that predicting the path of interest rates is notoriously difficult, particularly when inflation, employment, financial markets, and geopolitical developments are sending conflicting signals. The sharp shift in market expectations this year is a reminder of how quickly the rate outlook can change, and why neither markets nor policymakers should place too much weight on any single forecast. Ultimately, at least for the time being, Warsh may be best served by taking a measured approach and waiting for the data to provide greater clarity. In other words, with three different versions of the rate outlook in front of him (hikes, a continued pause, and cuts), perhaps the best advice is still the simplest: Hit the one in the middle!
Print PDF
The opinions expressed herein are those of Marquette Associates, Inc. (“Marquette”), and are subject to change without notice. This material is not financial advice or an offer to purchase or sell any product. Marquette reserves the right to modify its current investment strategies and techniques based on changing market dynamics or client needs.
11.09.2026
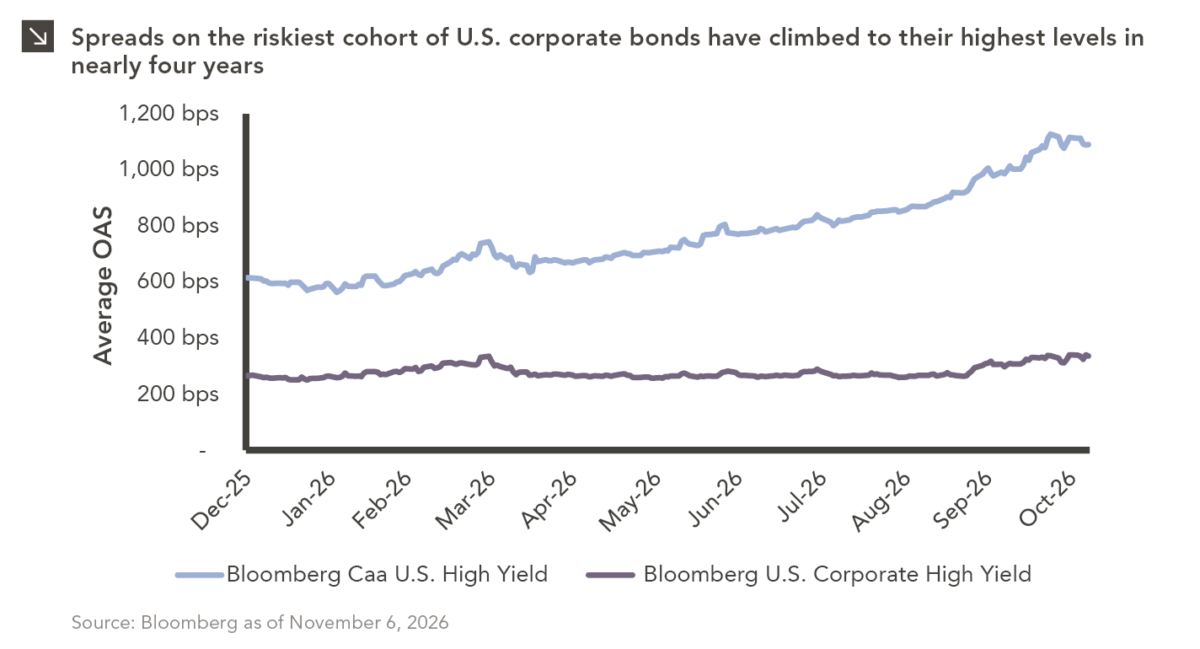
The U.S. distressed debt market is showing increasingly pronounced signs of stress. As of this writing, option-adjusted spreads on CCC-rated…
11.02.2026
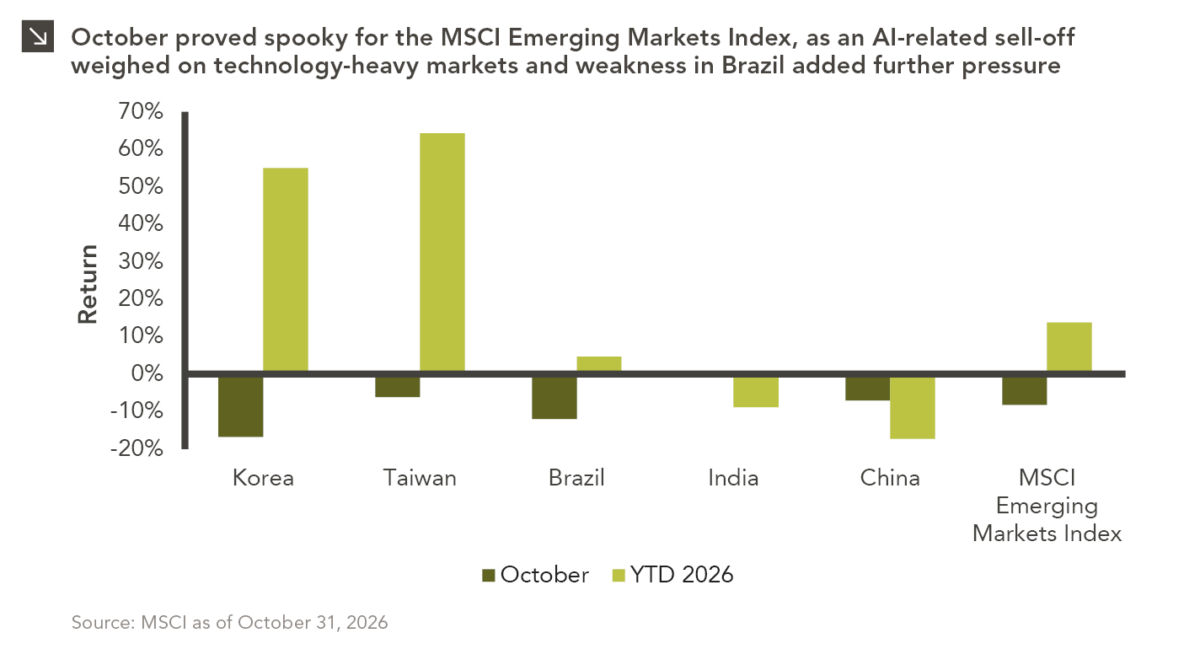
Emerging markets faced a challenging October, with the space declining by around 8.3% amid renewed concerns over the sustainability of…
10.26.2026
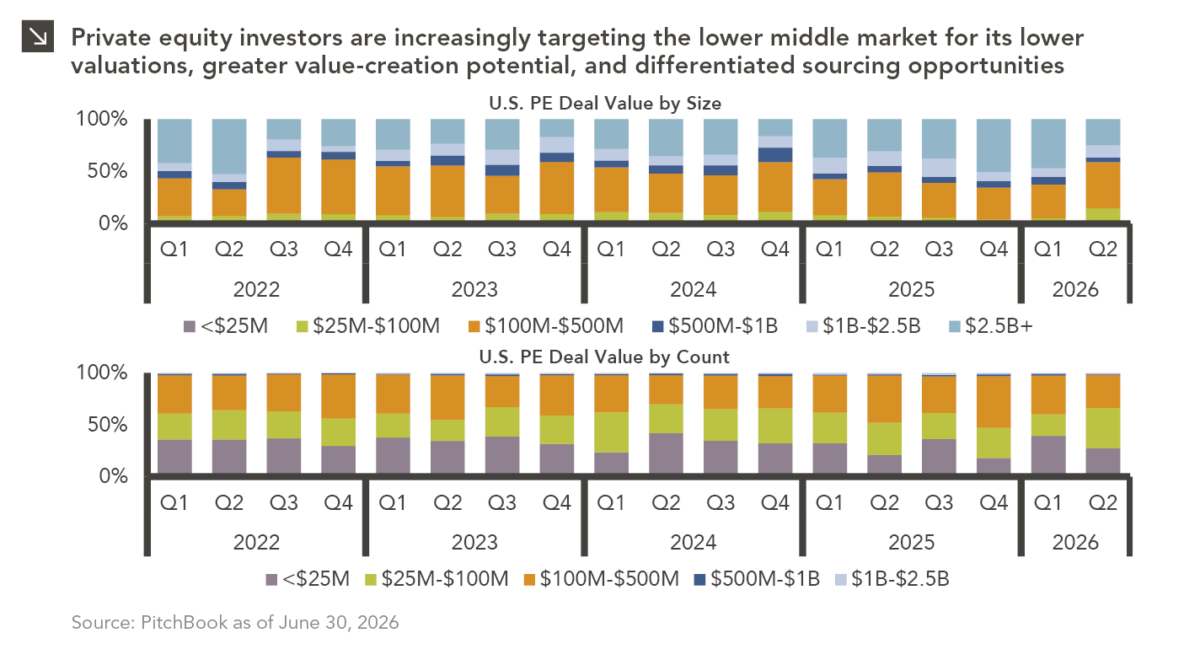
Private equity activity is increasingly shifting toward smaller transactions, with total deal value for transactions of $100 million or less…

10.08.2026
This video is a recording of a live webinar held October 22 by Marquette’s research team analyzing the third quarter…

10.22.2026
Anyone who has run a marathon knows the last six miles are brutal — no matter how well the first…
10.19.2026
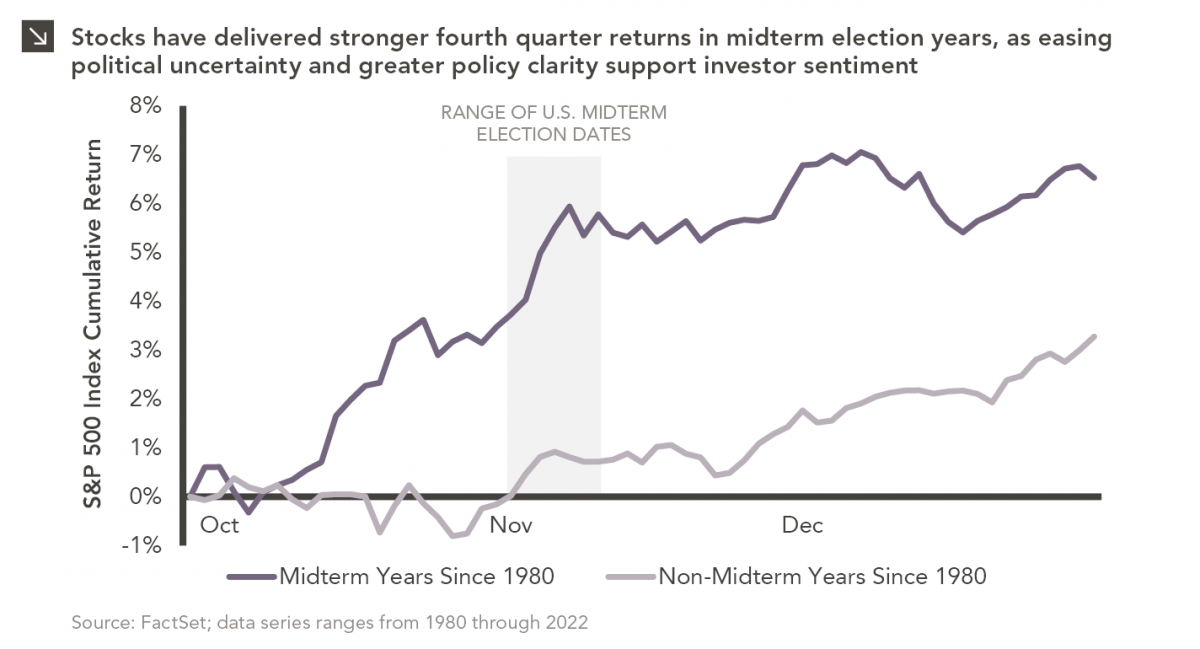
Since 1980, the S&P 500 Index has generally performed well in the weeks surrounding U.S. midterm elections. Specifically, the index…
Research alerts keep you updated on our latest research publications. Simply enter your contact information, choose the research alerts you would like to receive and click Subscribe. Alerts will be sent as research is published.
We respect your privacy. We will never share or sell your information.
If you have questions or need further information, please contact us directly and we will respond to your inquiry within 24 hours.
Contact Us >