Paige Thrana
Associate Research Analyst
Get to Know Paige


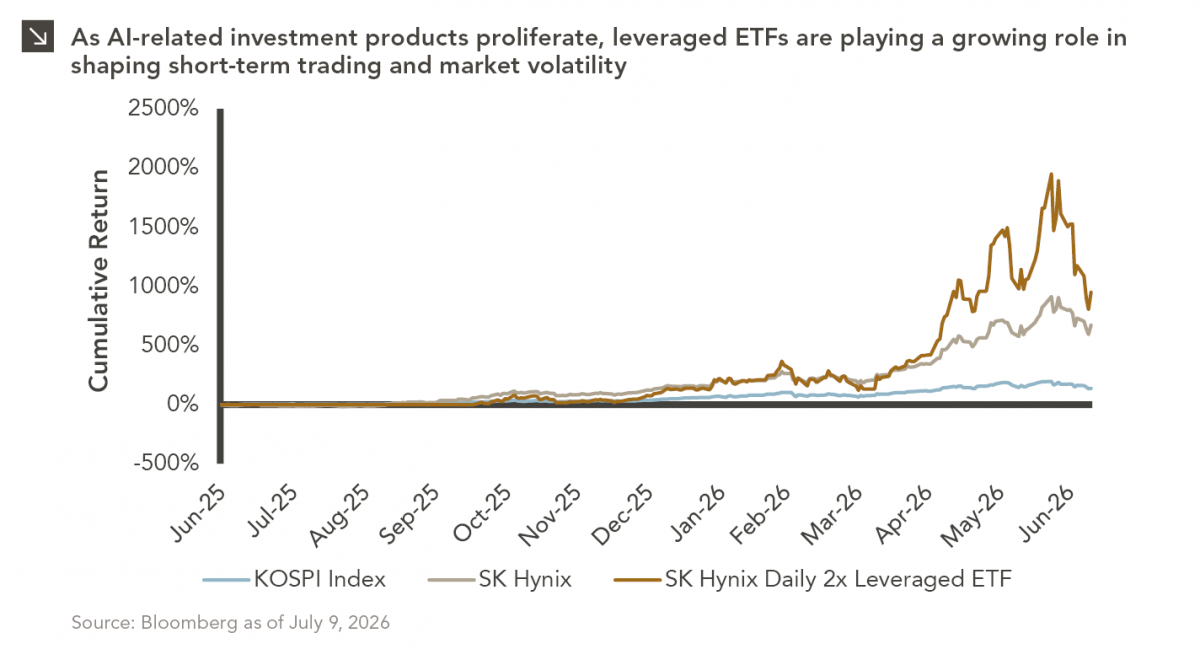
Our most recent Chart of the Week publication discussed how the AI investment opportunity has expanded beyond the large technology platforms to include critical suppliers throughout the semiconductor ecosystem and highlighted the strong performance of SK Hynix. As the AI investment theme continues to evolve, another important development has emerged: the growing influence of leveraged investment products on the trading dynamics of AI beneficiaries. Unlike traditional exchange-traded funds, single-stock leveraged ETFs seek to deliver a multiple of a stock’s daily return, allowing investors to express high-conviction views with magnified exposure. The SK Hynix Daily 2x Leveraged ETF, for example, attracted approximately $13 billion in assets after its October 2025 launch, and its success has prompted a wave of similar products. Indeed, following SK Hynix’s recent U.S. listing, issuers have begun launching leveraged ETFs tied to its U.S.-traded shares, broadening access to investors outside Asia.
The structure of leveraged ETFs creates a notable market dynamic. To maintain target leverage levels, these funds must rebalance their positions at the end of each trading day. When SK Hynix shares rise, the ETF generally needs to increase its exposure by purchasing additional derivatives or shares. Conversely, when the stock falls, the ETF typically must reduce its exposure. As assets in these funds have grown, these daily rebalancing trades have become large enough to represent a meaningful portion of SK Hynix’s trading volume. This creates the potential for feedback loops. During periods of strong momentum, ETF rebalancing can add incremental buying pressure that further supports the stock price. Conversely, market declines can trigger additional selling as the funds reduce exposure. Although company fundamentals continue to drive long-term value, these mechanical trading flows can increasingly influence short-term price movements and contribute to periods of heightened volatility.
Recent events provide a clear example of this dynamic. After an extraordinary rally fueled by optimism surrounding AI infrastructure spending and SK Hynix’s successful U.S. market debut, sentiment reversed sharply. The largest leveraged ETF tied to the company has lost roughly 45% since its debut, while SK Hynix experienced one of its steepest single-day declines in years. The rapid reversal prompted South Korean regulators to publicly question whether single-stock leveraged ETFs had been approved too quickly, highlighting growing concerns that these products can exacerbate market swings during periods of market stress. The implications of this dynamic extend beyond SK Hynix itself, as the company now represents one of the largest constituents of South Korean equity benchmarks and has become an increasingly important holding within the broader MSCI Emerging Markets Index. As a result, pronounced swings in SK Hynix shares can ripple through passive investment vehicles, affecting a much broader universe of global investors. The company’s recent U.S. listing and the expansion of leveraged products tied to both its Korean- and U.S.-listed shares further increase the number of investors participating in these technical trading flows. What began as a niche investment vehicle tied to a single stock has the potential to influence market performance across international equity portfolios.
While the long-term investment case for companies enabling AI infrastructure remains compelling, the rapid growth of leveraged products serves as a reminder that market structure can influence prices alongside fundamentals. The recent reversal in SK Hynix illustrates that leverage is inherently two-sided: the same mechanisms that can accelerate gains during periods of optimism can also amplify losses when sentiment shifts. For long-term investors, distinguishing between short-term technical factors and underlying business fundamentals will remain increasingly important as the AI investment theme continues to mature.
Print PDF
The opinions expressed herein are those of Marquette Associates, Inc. (“Marquette”), and are subject to change without notice. This material is not financial advice or an offer to purchase or sell any product. Marquette reserves the right to modify its current investment strategies and techniques based on changing market dynamics or client needs.

10.12.2026
This week’s chart highlights the accelerating growth of electricity demand in the U.S., which has been driven primarily by the…

10.08.2026
LIVE WEBINAR — OCTOBER 22 Please join Marquette’s research team for our 3Q 2026 Market Insights Webinar…

10.05.2026
For investors, the spookiest thing about October might not be the ghosts and monsters that are bound to show up…

09.28.2026
The phrase “expectations of higher inflation” has become a staple in financial news to explain the increase in nominal U.S….

09.21.2026
For much of the past several years, the conventional view has been that higher interest rates and stretched valuations would…

09.14.2026
There are many great things about working at Marquette Associates, but “Free Lunch Tuesday” is right at the top of…
Research alerts keep you updated on our latest research publications. Simply enter your contact information, choose the research alerts you would like to receive and click Subscribe. Alerts will be sent as research is published.
We respect your privacy. We will never share or sell your information.
If you have questions or need further information, please contact us directly and we will respond to your inquiry within 24 hours.
Contact Us >