Pooja Vyas
Research Analyst


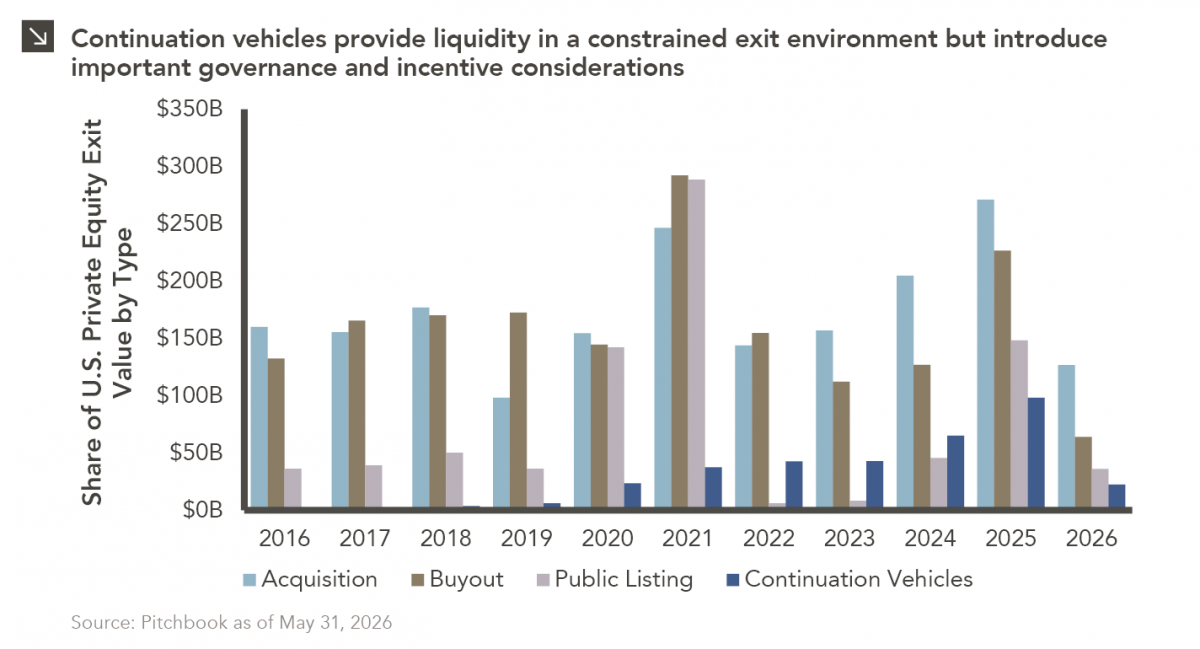
Since traditional exit routes have remained constrained in recent years due to higher interest rates, valuation gaps, and a subdued IPO market, continuation vehicles (“CVs”) have become an increasingly important liquidity tool for private equity investors. At a high level, CVs are investment structures in which a sponsor transfers one or more portfolio companies from an existing fund into a newly formed fund, allowing existing investors to either cash out or roll their investment while providing the manager with additional time to create value. While CVs do help to mitigate a challenging exit environment, they are also raising several considerations for fund investors. For instance, many are concerned about potential conflicts related to valuation, governance, and asset selection given the fund manager’s direct involvement in both the sale and acquisition process. These concerns often call for active discussions about asset valuation if third-party sales are considered. The economics of CVs have also been called into question by some, as the transfer of assets into a new vehicle can reset management fees and performance incentives for fund managers. Moreover, some CV structures include performance-related tiered carried interest arrangements, which may eventually result in a higher-than-industry-average fee paid by fund investors. Additionally, limited partners are closely examining the quality of assets being transferred since CVs can potentially reduce the impact of underperforming portfolio companies on a primary fund’s track record. CVs also offer less visibility into a fund manager’s ability to achieve traditional third-party exits, which remains an important measure of execution and realization capabilities.
More recently, the emergence of “CV-squared” transactions (in which assets move from one CV into another) has led to even more discussion around the ultimate path to liquidity and the alignment of incentives between fund managers and investors. While the rise of CVs is clearly a response to a market with constrained traditional exits, it is important to note that these structures are creating a more circular liquidity ecosystem that may make it harder for investors to evaluate portfolio company quality and exit opportunities. Ultimately, while continuation vehicles can provide valuable flexibility in a difficult exit environment, investors should carefully evaluate each transaction to ensure that governance, valuation, and incentive structures remain aligned with their long-term interests.
Print PDF
The opinions expressed herein are those of Marquette Associates, Inc. (“Marquette”), and are subject to change without notice. This material is not financial advice or an offer to purchase or sell any product. Marquette reserves the right to modify its current investment strategies and techniques based on changing market dynamics or client needs.

10.12.2026
This week’s chart highlights the accelerating growth of electricity demand in the U.S., which has been driven primarily by the…

10.08.2026
LIVE WEBINAR — OCTOBER 22 Please join Marquette’s research team for our 3Q 2026 Market Insights Webinar…

10.05.2026
For investors, the spookiest thing about October might not be the ghosts and monsters that are bound to show up…

09.28.2026
The phrase “expectations of higher inflation” has become a staple in financial news to explain the increase in nominal U.S….

09.21.2026
For much of the past several years, the conventional view has been that higher interest rates and stretched valuations would…

09.15.2026
Over the past decade, continuation vehicles (“CV”) have become one of the fastest-growing trends in private equity. Private equity funds…
Research alerts keep you updated on our latest research publications. Simply enter your contact information, choose the research alerts you would like to receive and click Subscribe. Alerts will be sent as research is published.
We respect your privacy. We will never share or sell your information.
If you have questions or need further information, please contact us directly and we will respond to your inquiry within 24 hours.
Contact Us >