Evan Frazier, CFA, CAIA
Senior Research Analyst


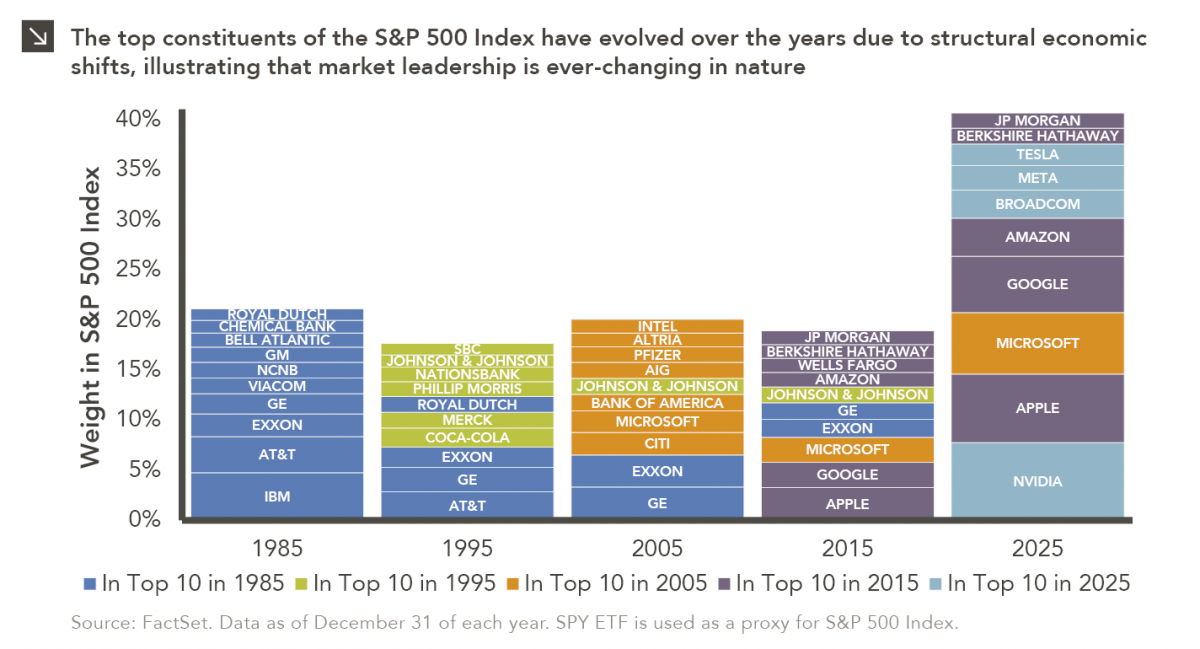
Rooted in medieval Persian Sufi thought, the adage “this too shall pass” speaks to the fleeting and impermanent nature of the human condition. For investors, this aphorism can serve as a useful framework for understanding the constantly evolving composition of the upper end of the U.S. equity market. As this week’s chart shows, the top 10 constituents of the S&P 500 Index have changed dramatically over the last 40 years, with each new decade seeing both additions to and subtractions from this basket of companies.
In 1985, the top of the S&P 500 Index was heavily weighted toward industrial conglomerates, energy producers, and legacy financial and telecommunications firms such as IBM, Exxon, AT&T, and General Electric. This composition reflected an economy still anchored in manufacturing, physical infrastructure, and regulated industries with durable but relatively slow-moving competitive dynamics. Capital intensity, domestic scale, and regulatory barriers to entry helped entrench incumbents, allowing a small set of diversified conglomerates and commodity-linked businesses to dominate equity indices. As can be observed in this week’s chart, the top 10 constituents represented roughly 21% of the S&P 500 Index in 1985. In contrast, the top 10 constituents at the end of last year represented more than 40% of the benchmark, with technology-oriented companies like NVIDIA, Apple, Microsoft, Alphabet, Amazon, and Meta topping the benchmark and accounting for an outsized share of index earnings and returns in recent years.
The transition between these two regimes did not occur abruptly but rather through decades of structural changes, including the rise of the digital economy, the decline in manufacturing’s share of GDP, and the increasing importance of intangible assets such as software, data, and intellectual property. Indeed, the 1990s and early 2000s saw the rise and consolidation of the internet economy, which led to the reshaping of information, communication, and commerce. The years following the Global Financial Crisis further accelerated the dominance of scalable, asset-light business models, while low interest rates and abundant liquidity disproportionately benefited high-growth technology firms. At the same time, several former index leaders either stagnated, were disrupted, or lost relative economic relevance, leading to a gradual but persistent turnover at the top of the index.
Against this backdrop, the current composition of the S&P 500 Index should not be viewed as fixed, but rather as a snapshot of a specific moment in time. If history is any indication, the next decade will likely bring another reshuffling of top index constituents as new technologies, industries, and business models emerge. For investors, this suggests that maintaining broadly diversified equity exposure while remaining disciplined around rebalancing is prudent, as market leadership, however dominant it appears at a given time, has historically been transient rather than permanent.
Print PDF
The opinions expressed herein are those of Marquette Associates, Inc. (“Marquette”), and are subject to change without notice. This material is not financial advice or an offer to purchase or sell any product. Marquette reserves the right to modify its current investment strategies and techniques based on changing market dynamics or client needs.

10.22.2026
Anyone who has run a marathon knows the last six miles are brutal — no matter how well the first…

10.19.2026
Since 1980, the S&P 500 Index has generally performed well in the weeks surrounding U.S. midterm elections. Specifically, the index…

10.12.2026
This week’s chart highlights the accelerating growth of electricity demand in the U.S., which has been driven primarily by the…

10.08.2026
LIVE WEBINAR — OCTOBER 22 Please join Marquette’s research team for our 3Q 2026 Market Insights Webinar…

10.05.2026
For investors, the spookiest thing about October might not be the ghosts and monsters that are bound to show up…

09.28.2026
The phrase “expectations of higher inflation” has become a staple in financial news to explain the increase in nominal U.S….
Research alerts keep you updated on our latest research publications. Simply enter your contact information, choose the research alerts you would like to receive and click Subscribe. Alerts will be sent as research is published.
We respect your privacy. We will never share or sell your information.
If you have questions or need further information, please contact us directly and we will respond to your inquiry within 24 hours.
Contact Us >