07.24.2026
2026 Halftime Market Insights
This video is a recording of a live webinar held July 23 by Marquette’s research team analyzing the first half…
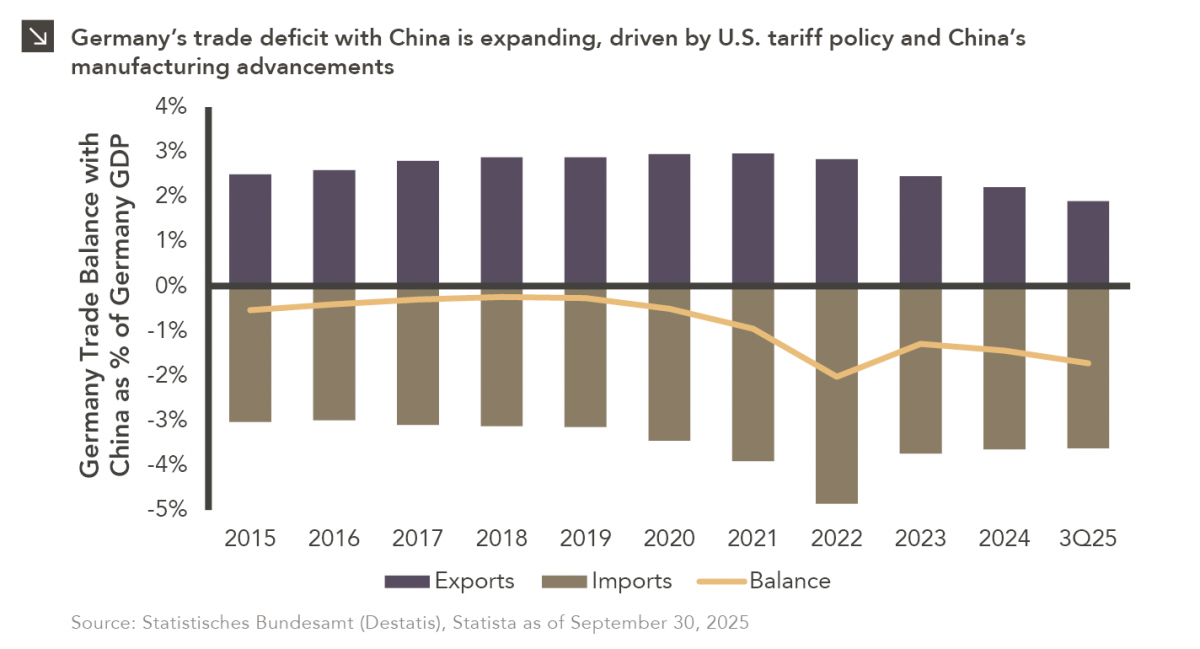
Germany is on pace for a record-breaking trade deficit with China this year, with Chinese exports originally intended for the United States now flooding European markets. Specifically, Germany currently exhibits a trade balance with China of roughly -1.7% of German GDP, which is close to a multi-year low. Germany’s increasingly negative trade balance with China can be observed in this week’s chart. While trade imbalances are not necessarily cause for concern, this growing deficit is part of a long-term structural shift in the trade relationship between Germany and China. Despite ideological differences, the two countries have been economic allies since establishing a trade partnership in the early 2000s, which led to the exporting of German cars, machinery, and specialty chemicals to China. This, in turn, fueled economic growth in China, and the relationship benefited both countries for years (though not without growing concerns around potential economic dependence of Germany on China). This dynamic changed in 2020 given pandemic-induced supply chain shocks and China’s alignment with Russia at the outset of its invasion of Ukraine. These headwinds reaffirmed Germany’s commitment to diversifying its economic relationships, and last year the United States overtook China as Germany’s number one trading partner for the first time in nearly a decade. While China has reclaimed the top spot this year, trade between the two countries is not what it once was. For instance, many Chinese households now prefer the latest car model from BYD (a multinational manufacturing company domiciled in China) as opposed to the once coveted German Volkswagen. Chinese officials have also threatened to limit exports of certain rare earth minerals and semiconductor chips, which are crucial inputs for goods manufactured in Germany.
The future of this once vibrant and amicable economic partnership remains unclear. German manufacturers now face stiff competition from what was previously significant end-markets, and the country seems to be adopting the more cautious stance on China exhibited by the rest of Europe. Indeed, while some German firms are deepening their relationship with China to stay connected with technological innovation, the nature of aggregate German manufacturing may be changing, especially as the country’s economic output becomes increasingly tied to services rather than goods. Eventually, China and Germany will reach a trade equilibrium, though current trends suggest it will look vastly different from their prior decades of collaboration.
Print PDFThe opinions expressed herein are those of Marquette Associates, Inc. (“Marquette”), and are subject to change without notice. This material is not financial advice or an offer to purchase or sell any product. Marquette reserves the right to modify its current investment strategies and techniques based on changing market dynamics or client needs.

07.24.2026
This video is a recording of a live webinar held July 23 by Marquette’s research team analyzing the first half…
07.22.2026
The usual midyear version of these letters has touched on year-to-date performance as well as the most influential macroeconomic and…

07.20.2026
Our most recent Chart of the Week publication discussed how the AI investment opportunity has expanded beyond…

07.13.2026
One of the enduring lessons of the California Gold Rush is that the greatest fortunes were often made not by…

07.06.2026
Since traditional exit routes have remained constrained in recent years due to higher interest rates, valuation gaps, and a subdued…

06.29.2026
This week’s chart highlights the varying return profiles across key infrastructure sectors by illustrating the split between income and capital…
Research alerts keep you updated on our latest research publications. Simply enter your contact information, choose the research alerts you would like to receive and click Subscribe. Alerts will be sent as research is published.
We respect your privacy. We will never share or sell your information.
If you have questions or need further information, please contact us directly and we will respond to your inquiry within 24 hours.
Contact Us >