12.29.2025
Glass Half Empty
While the holiday season was once marked by bustling bars, readers may notice that nightlife isn’t what it used to…
Most investors understand that over the long-term, the investment grade credit sector tends to outperform the U.S. government sector due to its risk. Many may be surprised however, at the size of the outperformance. Since its 1973 inception to May 2012, the BarCap U.S. Credit Index has outperformed the BarCap Government Index by just 38bps. Today’s Chart of the Week shows the rolling three year outperformance of the BarCap Credit Index versus the BarCap Government Index. Up until 2007, credit enjoyed a long period of relatively steady outperformance, interrupted by the recession after the tech bubble burst.
To achieve this outperformance, investors in credit would have experienced a standard deviation of 7.79%, compared to 5.61% for governments. The maximum decline for credit versus governments was -19.26%, and -7.92% respectively. This decline in credit was actually experienced from September 1979 to March of 1980, not in 2008.
Thus, while the credit crunch of 2008 was an extreme event, the actual margin of underperformance in credit had been seen before in the 1980’s. It is also important to note that the raw outperformance numbers are likely overstated in favor of the credit index, which has a longer duration. As rates have been in a secular downward trend over the past 30-years, this has boosted longer duration returns. The duration of the BarCap Credit Index as of May 31 was 6.73, compared to 5.43 for the BarCap Government Index. From 1997 to 2012, the period for which duration numbers are available, the credit index has had an average duration 0.91 higher than the government index.
Of course, past returns do not necessarily predict future returns. The forward outlook for credit has tended to be more positive during periods of elevated spreads, as investors are paid a higher premium to take on credit risk. As of the end of May, the option adjusted spread of the BarCap Credit Index was 193bps, compared to its long-term average of 121bps.
The opinions expressed herein are those of Marquette Associates, Inc. (“Marquette”), and are subject to change without notice. This material is not financial advice or an offer to purchase or sell any product. Marquette reserves the right to modify its current investment strategies and techniques based on changing market dynamics or client needs.
12.29.2025
While the holiday season was once marked by bustling bars, readers may notice that nightlife isn’t what it used to…
12.22.2025
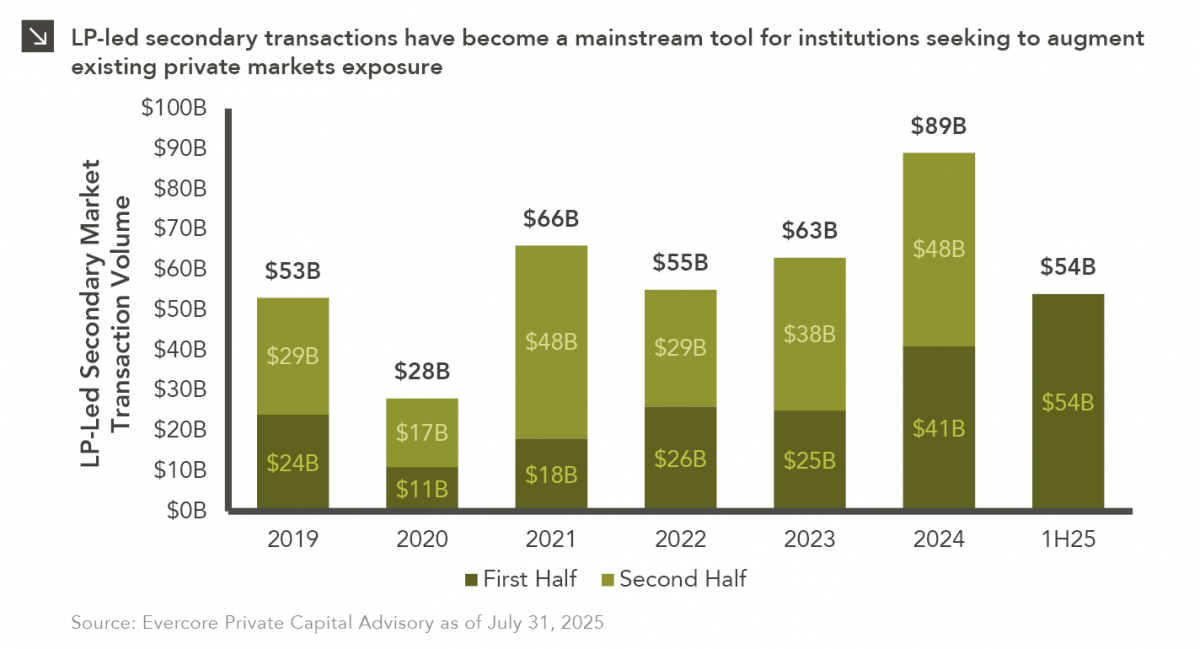
Private equity is known for being an illiquid asset class, with investments typically locked up for several years and limited…

12.15.2025
While technology-oriented firms have made their presence known in equity markets for several years, these companies have made waves in…
12.08.2025
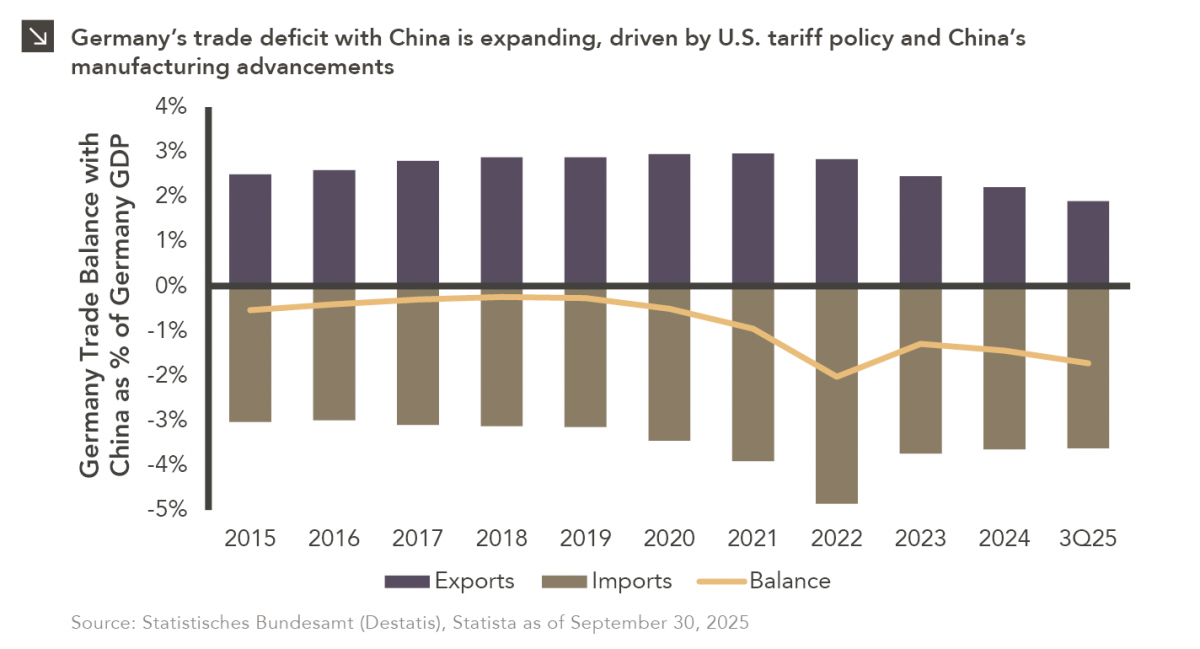
Germany is on pace for a record-breaking trade deficit with China this year, with Chinese exports originally intended for the…
12.01.2025
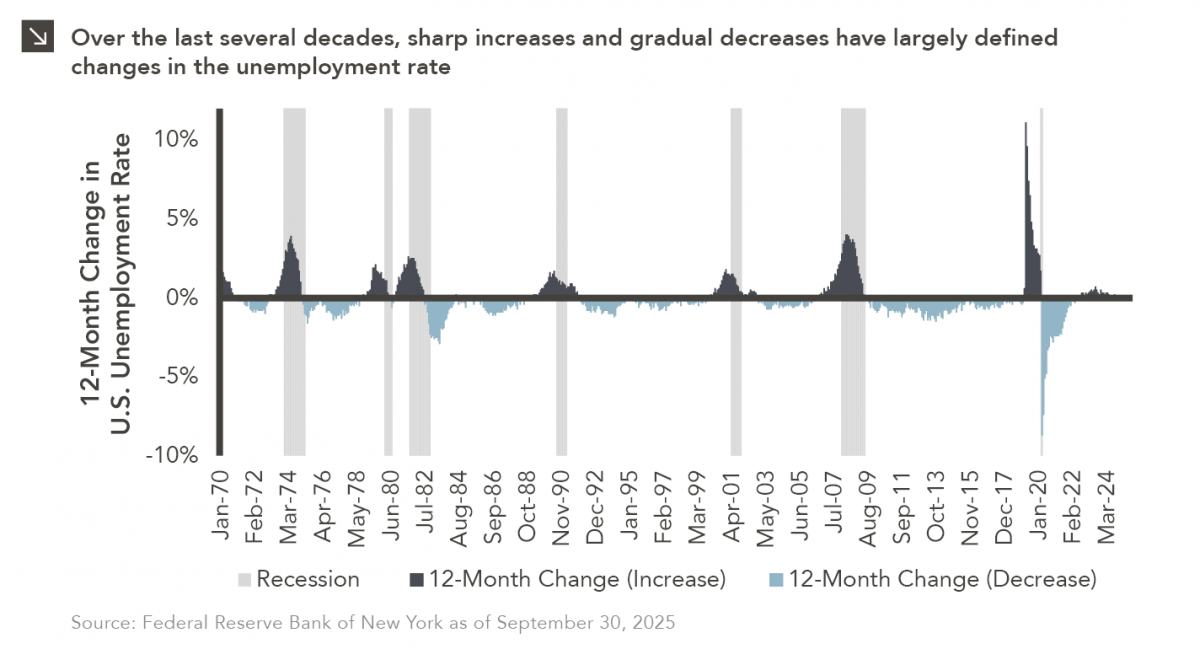
A fundamental characteristic of U.S. labor markets is the pronounced asymmetry in unemployment dynamics, as joblessness rises anywhere from three…
11.24.2025
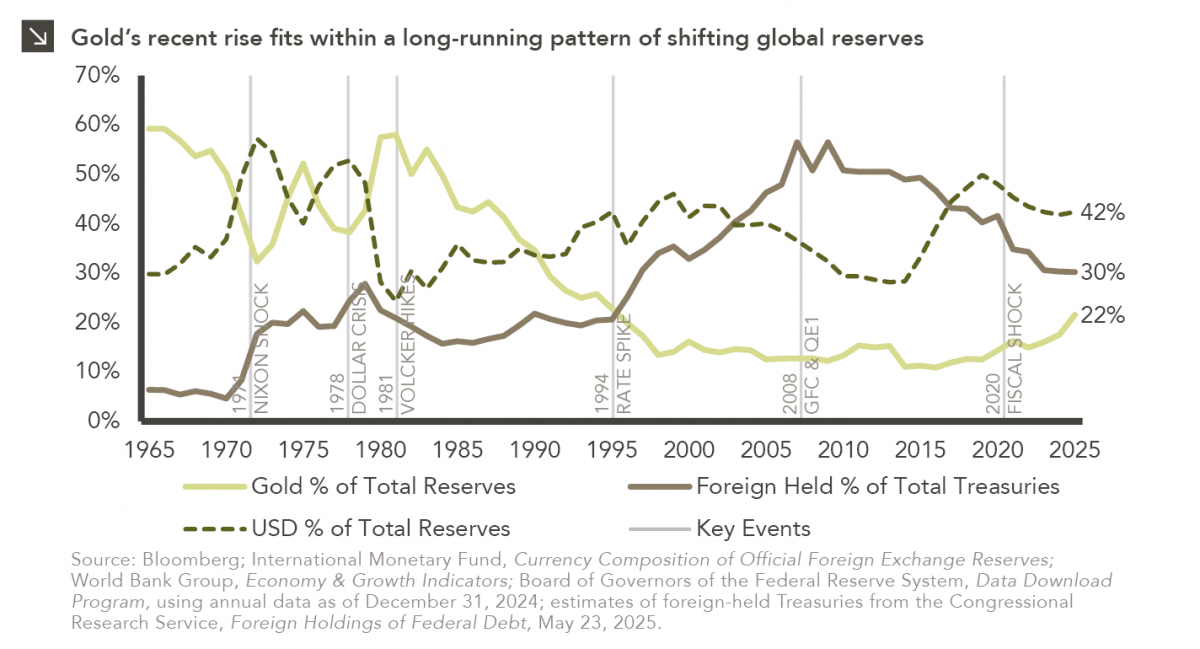
With gold now trading near $4,000 per ounce after a steady multi-year climb, investor attention has turned to the potential…
Research alerts keep you updated on our latest research publications. Simply enter your contact information, choose the research alerts you would like to receive and click Subscribe. Alerts will be sent as research is published.
We respect your privacy. We will never share or sell your information.
If you have questions or need further information, please contact us directly and we will respond to your inquiry within 24 hours.
Contact Us >