David Lewandowski
Research Analyst, Sustainable Investing
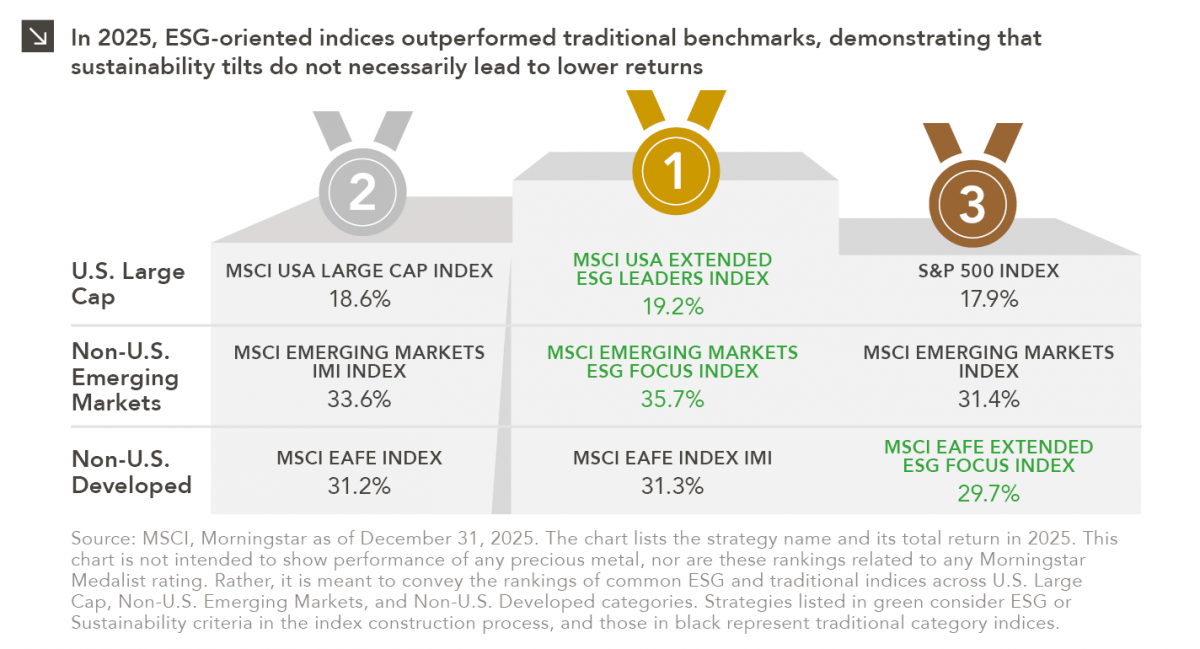
Performance is a key attribute of any investment strategy with a values-based or sustainability focus. As such, analyzing the 2025 returns of traditional indices and those of their ESG-integrated equivalents seemed like a worthwhile endeavor, especially given the 25th Winter Olympic Games currently taking place in Italy. The purpose of this assessment was to evaluate how ESG-oriented indices performed against traditional indices in the U.S. Large Cap, Emerging Markets, and Developed International equity spaces to determine the “passive performance medalists” of 2025.
Before evaluating returns, it is important to outline how ESG-oriented indices are constructed, given that a degree of tracking error is always to be expected from these benchmarks. According to MSCI, each ESG index seeks a risk and return profile that is similar to the broad market index it is designed to track, while also targeting improved sustainability characteristics and avoiding controversies. Of course, nuances exist across different flavors of sustainability indices. For instance, the “ESG Leaders” approach differs slightly from that of “ESG Focused” indices in that it overweights higher scoring ESG names against sector peers and utilizes additional screens. Key examples include the following:
The time has now come to award the medals. In the U.S. Large Cap space, the ESG Leaders approach landed atop the podium in 2025, as overweight positions in best-in-class Communication Services companies proved fruitful last year. Within Emerging Markets, the MSCI EM ESG Focus Index took home gold with the highest absolute outperformance thanks to positive stock selection effects in sectors including Information Technology, Health Care, and Energy (where being underweight also contributed to excess returns). Finally, a photo finish determined the gold/silver outcome for traditional indices in the EAFE space. The MSCI EAFE ESG Index trailed the two traditional benchmarks due to its weapons-related exclusions and lower exposure to companies in construction and mining spaces, which hampered relative returns given Europe’s increased focus on defense and infrastructure.
The fact that passive ESG indices fared well outside of the EAFE space in 2025 serves as a reminder that funds that track these benchmarks may make sense for the following types of market participants:
It is important to note that understanding the nuances of different ESG-focused products is crucial, as many involve exclusions, additional risk management levers, and screens that will create absolute and relative performance variability. Still, if a lesson can be learned from 2025, it is that investors can enjoy strong performance from passive equity strategies while also tilting toward securities with more sustainable characteristics.
Print PDF
The opinions expressed herein are those of Marquette Associates, Inc. (“Marquette”), and are subject to change without notice. This material is not financial advice or an offer to purchase or sell any product. Marquette reserves the right to modify its current investment strategies and techniques based on changing market dynamics or client needs.

07.24.2026
This video is a recording of a live webinar held July 23 by Marquette’s research team analyzing the first half…
07.22.2026
The usual midyear version of these letters has touched on year-to-date performance as well as the most influential macroeconomic and…

07.20.2026
Our most recent Chart of the Week publication discussed how the AI investment opportunity has expanded beyond…

07.13.2026
One of the enduring lessons of the California Gold Rush is that the greatest fortunes were often made not by…

07.06.2026
Since traditional exit routes have remained constrained in recent years due to higher interest rates, valuation gaps, and a subdued…

06.29.2026
This week’s chart highlights the varying return profiles across key infrastructure sectors by illustrating the split between income and capital…
Research alerts keep you updated on our latest research publications. Simply enter your contact information, choose the research alerts you would like to receive and click Subscribe. Alerts will be sent as research is published.
We respect your privacy. We will never share or sell your information.
If you have questions or need further information, please contact us directly and we will respond to your inquiry within 24 hours.
Contact Us >