David Hernandez, CFA
Director of Traditional Manager Search
2022 has been a challenging year for investors as both bonds and equities have produced substantial losses. This unusual environment is the product of a kaleidoscope of macro headwinds that have unfolded throughout the year. Against this backdrop, active emerging markets equity managers have generally failed to protect to the downside, with the average manager underperforming the index year to date through September.
There are several potential reasons why active managers have struggled in 2022. The Russian invasion of Ukraine in February caught most market participants off guard and resulted in substantial losses. China’s underperformance relative to the broader index has also served as a headwind for many investors. China is the largest exposure in the MSCI EM Index at 31% and has been challenging for managers to navigate this year given the country’s Zero-COVID Policy, property sector struggles, and negative investor sentiment amid geopolitical tensions. And lastly, the factor environment has dramatically shifted this year, with both Growth and Quality underperforming the broad benchmark. This newsletter further explores the impact that the underperformance of Quality has had on active manager returns this year.
Read > Emerging Markets: Why Your Active Manager May Be Underperforming


The opinions expressed herein are those of Marquette Associates, Inc. (“Marquette”), and are subject to change without notice. This material is not financial advice or an offer to purchase or sell any product. Marquette reserves the right to modify its current investment strategies and techniques based on changing market dynamics or client needs.
06.25.2026
Commodities represent a unique asset class within global financial markets. Like equities and bonds, commodity prices are influenced by the…

06.01.2026
The MSCI Emerging Markets Index has undergone a significant structural transformation in recent years. For much of the past decade,…

05.11.2026
In addition to the humanitarian toll of the conflict in Iran, the world is currently confronting the impact that trade…
05.07.2026
The leadership structure of the Federal Reserve is intentionally designed to promote continuity, independence, and institutional stability across political cycles….
04.27.2026
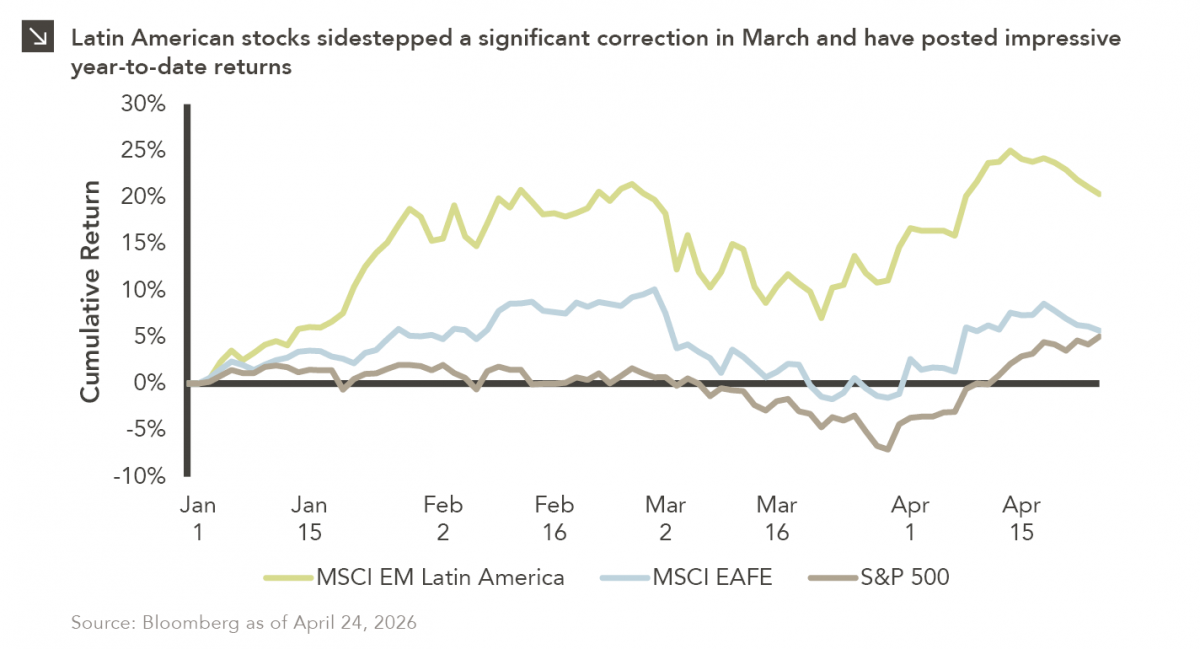
Latin American equity markets have shown remarkable strength in 2026. After a strong start to the year, the MSCI Emerging…
04.23.2026
Diversify. Rebalance. Stay invested. Every one of these letters has concluded with that same advice in some shape or form….
Research alerts keep you updated on our latest research publications. Simply enter your contact information, choose the research alerts you would like to receive and click Subscribe. Alerts will be sent as research is published.
We respect your privacy. We will never share or sell your information.
If you have questions or need further information, please contact us directly and we will respond to your inquiry within 24 hours.
Contact Us >