Don’t Fight the Flows

June 28, 2023 | Jessica Noviskis, CFA, Portfolio Strategist, OCIO Services

While not as commonly dissected as earnings and multiples, liquidity is a key driver of equity markets. An influx of liquidity set up both the tech and real estate bubbles, which burst as that capital dried up, leading to severe market corrections in the early 2000s and in 2008. The easy credit environment that followed the Global Financial Crisis facilitated one of the longest and strongest bull markets in U.S. history. An unprecedented amount of stimulus injected into the financial system amid the COVID pandemic led to the sharpest stock market upturn on record. And now in 2023, amid an increase in liquidity and despite heightened macro uncertainties, a hawkish Fed, and a banking crisis, the S&P 500 is up 14%¹ nearing the end of the second quarter while the CBOE Volatility Index (VIX) has retreated to below-average levels.

Read > Don’t Fight the Flows

¹Through June 27, 2023


The opinions expressed herein are those of Marquette Associates, Inc. (“Marquette”), and are subject to change without notice. This material is not financial advice or an offer to purchase or sell any product. Marquette reserves the right to modify its current investment strategies and techniques based on changing market dynamics or client needs.

Jessica Noviskis, CFA
Portfolio Strategist, OCIO Services

Get to Know Jessica

The opinions expressed herein are those of Marquette Associates, Inc. (“Marquette”), and are subject to change without notice. This material is not financial advice or an offer to purchase or sell any product. Marquette reserves the right to modify its current investment strategies and techniques based on changing market dynamics or client needs.

Related Content

Two-line chart showing Private Construction Spending for Data Centers and Public Construction Spending for Transportation from December 2013 to present in billions of dollars. Data Centers in 2013 were $1.6 billion and Transportation was $28.7 billion. Since 2022, Data Center spending has increased quickly; Transportation has increased overall but relatively steadily. April 30, 2026 data point for Data Centers was 50.7, while Transportation was 49.9. For full dataset, please contact marquettemarketing@marquetteassociates.com.

06.15.2026

Centers of Attention

The rapid buildout of artificial intelligence infrastructure is reshaping the U.S. investment landscape. According to recent Census Bureau data, spending…

05.26.2026

The Best and Worst of Times

The classic novel A Tale of Two Cities by Charles Dickens begins with the line “It was the best of…

Four-line chart showing weight in Bloomberg Aggregate U.S. Bond Index for Treasuries, Government-Related, Corporate, and Securitized sub-indices, 12/31/1999 through 3/31/2026. For date range shown, Treasuries started at 31.7% and end at 45.9%. Government-Related start at 11.4% and end at 4.3%. Corporates start at 20.9% and end at 23.9%. Securitized start at 36.0% and end at 25.9%. For full dataset, please contact marquettemarketing@marquetteassociates.com.

05.18.2026

The “Magnificent One”

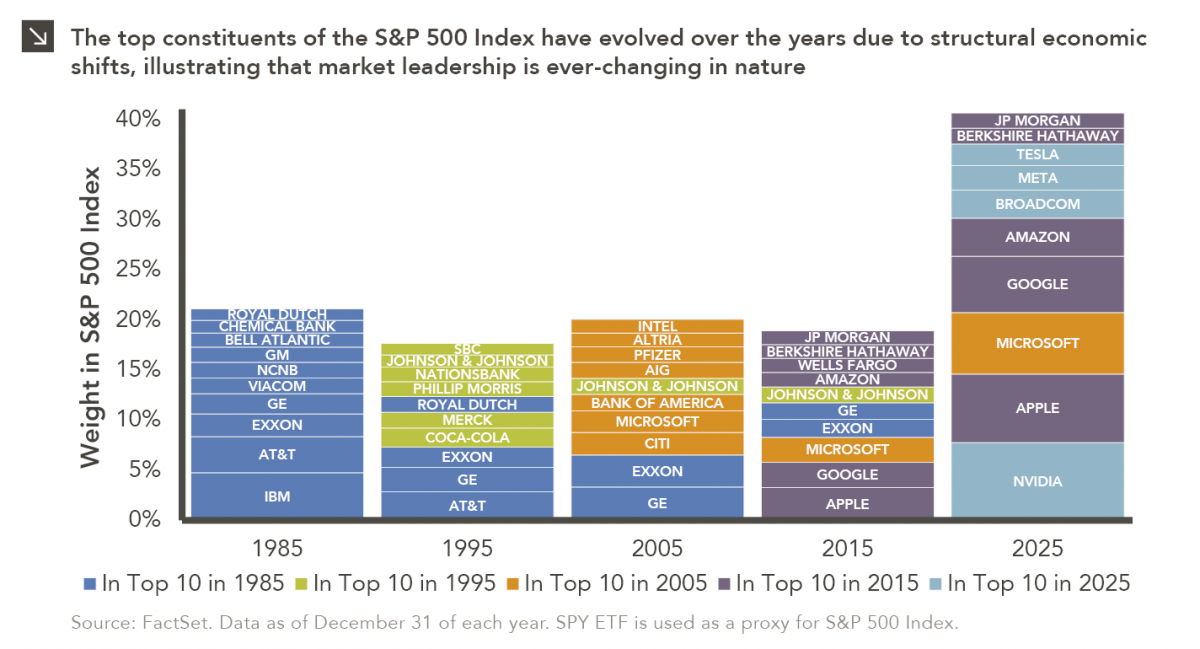
Over the last few years, equity markets have been defined by a group of stocks often referred to as the…

Combination column and line chart showing increase in non-renewables and renewables in net installed capacity (GW) in columns and share of new electricity generating capacity by renewables (line) annually since 2005. Renewables ave seen a marked increase in recent years (183.95GW in 2019 to 691.94GW in 2025). Renewable Share was at 86% for 2025. For full dataset, please contact marquettemarketing@marquetteassociates.com.

05.11.2026

A Renewed Focus on Renewables

In addition to the humanitarian toll of the conflict in Iran, the world is currently confronting the impact that trade…

05.07.2026

The Fed Tackles Succession Planning

The leadership structure of the Federal Reserve is intentionally designed to promote continuity, independence, and institutional stability across political cycles….

Stacked column chart showing Weight in S&P 500 Index in 1985, 1995, 2005, 2015, and 2025 for top 10 companies at that time, with companies stacked for each year by weight. From 1985-2015, top 10 weight ranged from 17.6% to 21.1%, but 2025's weight was 40.6%. Company makeup changes over time, with no companies from 1985/1995 categories in 2025. For full dataset, please contact marquettemarketing@marquetteassociates.com.

05.04.2026

This Too Shall Reconstitute

Rooted in medieval Persian Sufi thought, the adage “this too shall pass” speaks to the fleeting and impermanent nature of…

More articles

Subscribe to Research Email Alerts

Research Email Alert Subscription

Research alerts keep you updated on our latest research publications. Simply enter your contact information, choose the research alerts you would like to receive and click Subscribe. Alerts will be sent as research is published.

We respect your privacy. We will never share or sell your information.

Thank You

We appreciate your interest in Marquette Associates.

If you have questions or need further information, please contact us directly and we will respond to your inquiry within 24 hours.

Contact Us >