James Torgerson
Senior Research Analyst


As interest rates remain elevated, some market participants have questioned the extent to which the maturity wall in the below investment grade fixed income market is a sign of increased risk. On paper, concerns related to the maturity wall are understandable, as high yield and leveraged loan issuers face higher financing costs due to increased credit risk. Further, these companies could struggle to refinance debt as it matures and, as a result, incur much higher interest expenses in the future. These dynamics may lead to an eventual increase in default rates and create headwinds for fixed income performance.
In recent time, however, there have not been significant issues when it comes to below investment grade issuers refinancing debt and extending maturities. Since the beginning of 2023, the amount of high yield and leveraged loan debt maturing in 2024, 2025, and 2026 has been reduced by a combined $472 billion, which constitutes roughly 17% of the current market for outstanding high yield bonds and leveraged loans. Additionally, the pace of refinancings and the reduction in impending maturities has only accelerated over the more recent term, as issuers took advantage of lower interest rates in the fourth quarter of last year to term out debt. To that point, more than $54 billion of high yield and leveraged loans have been refinanced over the past three months alone. This is roughly double the pace of 2022, during which $28 billion was refinanced every three months, and nearly five times the $11 billion being refinanced every three months in 2021, during which the market for new issuance was almost non-existent.
Although refinancings abound in 2024, concerns related to impending maturities are not entirely unfounded. Over the next three years, over 21% of the below investment grade market is scheduled to mature. While this number is down slightly from year-end, it remains close to recent-term highs. However, this increased pace of refinancings is a welcome sign for fixed income markets broadly. Fundamentals remain resilient in the below investment grade space, and this resilience will likely allow companies to bear higher interest costs and continue to extend out maturities to time periods that may exhibit more rate favorability.
Print PDF
The opinions expressed herein are those of Marquette Associates, Inc. (“Marquette”), and are subject to change without notice. This material is not financial advice or an offer to purchase or sell any product. Marquette reserves the right to modify its current investment strategies and techniques based on changing market dynamics or client needs.
11.09.2026
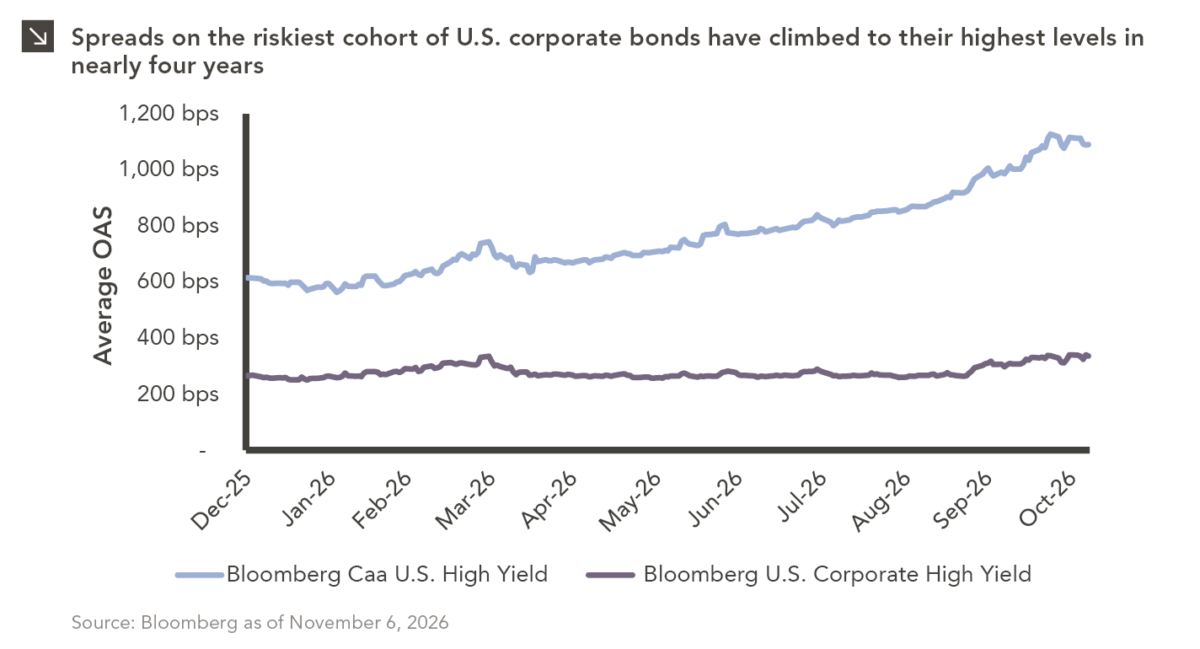
The U.S. distressed debt market is showing increasingly pronounced signs of stress. As of this writing, option-adjusted spreads on CCC-rated…
11.02.2026
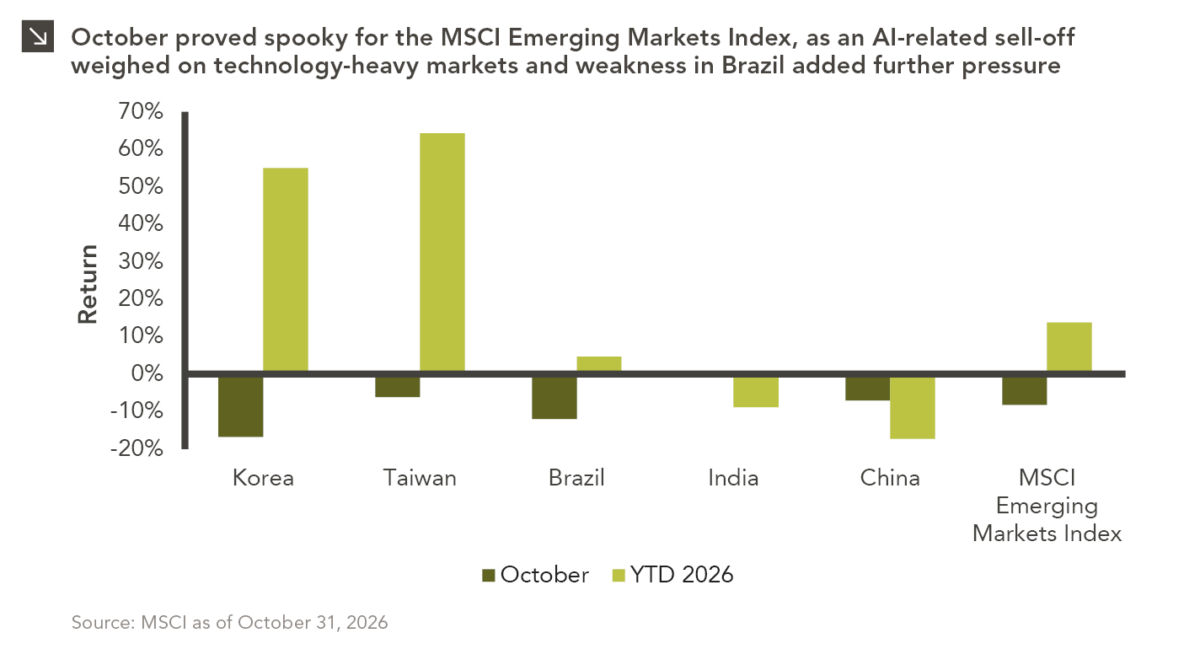
Emerging markets faced a challenging October, with the space declining by around 8.3% amid renewed concerns over the sustainability of…
10.26.2026
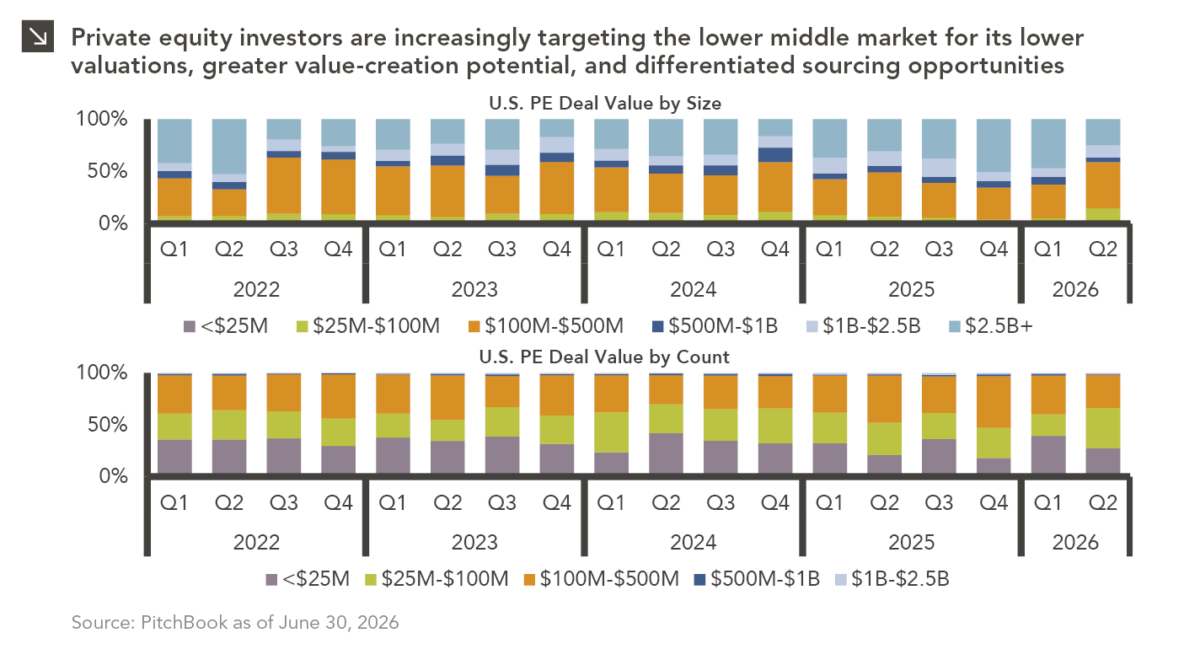
Private equity activity is increasingly shifting toward smaller transactions, with total deal value for transactions of $100 million or less…

10.08.2026
This video is a recording of a live webinar held October 22 by Marquette’s research team analyzing the third quarter…

10.22.2026
Anyone who has run a marathon knows the last six miles are brutal — no matter how well the first…
10.19.2026
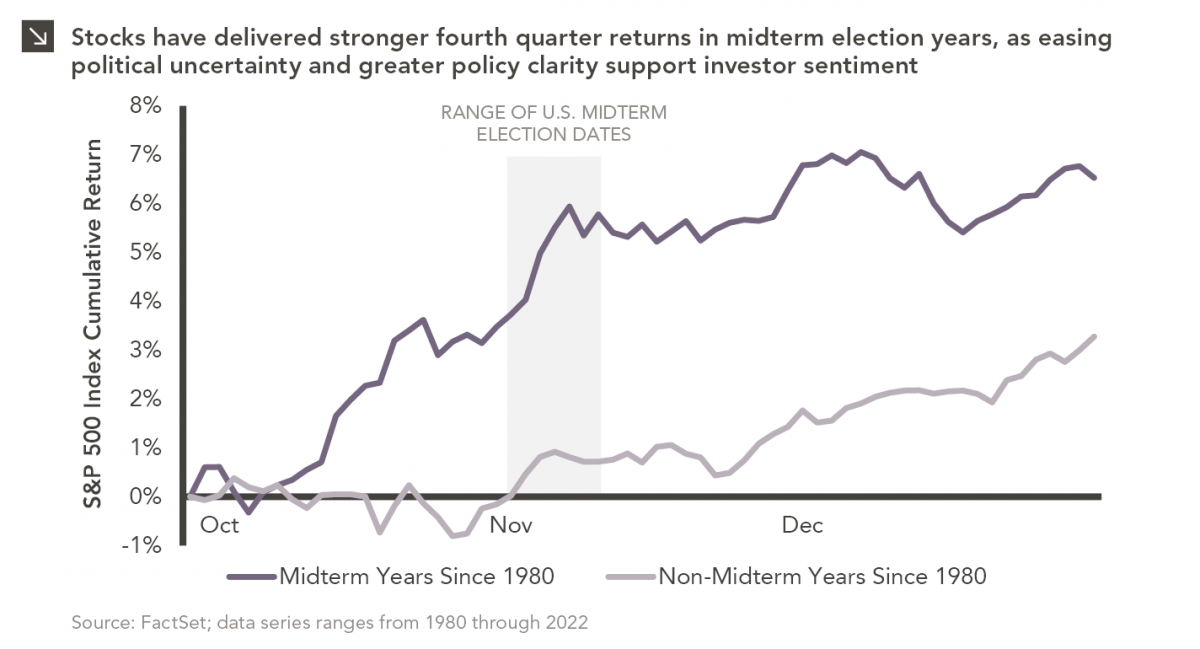
Since 1980, the S&P 500 Index has generally performed well in the weeks surrounding U.S. midterm elections. Specifically, the index…
Research alerts keep you updated on our latest research publications. Simply enter your contact information, choose the research alerts you would like to receive and click Subscribe. Alerts will be sent as research is published.
We respect your privacy. We will never share or sell your information.
If you have questions or need further information, please contact us directly and we will respond to your inquiry within 24 hours.
Contact Us >