Evan Frazier, CFA, CAIA
Senior Research Analyst


In a report published last week, the Organization for Economic Cooperation and Development sharply lowered its global economic growth outlook, pointing to the disruptive impact of ongoing trade tensions. Global GDP is now projected to grow by 2.9% on a year-over-year basis in 2025, down from an estimate of 3.1% in March. The United States economy is expected to grow by 1.6% this year, which represents a sharp downgrade from the March forecast of 2.2% by the OECD. Indeed, out of the countries outlined in this week’s chart, only India saw its 2025 economic growth estimates revised upward in the most recent OECD projections, with forecasts for the euro area and Japan remaining in line with where they stood in March. These assessments underscore the reality of trade disruptions as major drags on global economic momentum. Further, the OECD emphasized in its report that even a complete rollback of tariffs by the U.S. and other nations would not provide an immediate boost to the global economy due to lingering uncertainty about the direction of future policy.
In addition to trade headwinds, the OECD pointed out that domestic factors are compounding U.S. economic challenges, with immigration restrictions and a shrinking federal workforce contributing to weaker growth prospects. Additionally, despite tariff-generated revenues (which hit an all-time high last month), the U.S. budget deficit is expected to widen as slowing economic activity will likely outweigh any fiscal gains from trade barriers. Inflation in the U.S. will also rise in the near term according to OECD forecasters, which could delay substantive monetary easing by the Federal Reserve until at least 2026. The report cautions that this timeline could be pushed even further if inflation expectations become unmoored. Beyond the immediate economic implications of trade disputes, the OECD raised alarm about mounting global fiscal pressures and urged governments to streamline spending and improve revenue collection by expanding their tax bases. Clearly, policymakers around the world have much to evaluate as we prepare to enter the second half of 2025.
Print PDF
The opinions expressed herein are those of Marquette Associates, Inc. (“Marquette”), and are subject to change without notice. This material is not financial advice or an offer to purchase or sell any product. Marquette reserves the right to modify its current investment strategies and techniques based on changing market dynamics or client needs.

08.31.2026
Private equity has always had a few portfolio companies that refused to leave the party. Today, however, the industry appears…

08.24.2026
The global bond market is facing renewed pressure as investors demand higher yields to hold long-dated government debt, pushing borrowing…

08.17.2026
As a college football player struggling to put on mass, the “supersizing” deal at McDonald’s was hard to beat. For…

08.10.2026
After reaching nearly ¥164 per dollar, its weakest level in roughly four decades, the yen had become a source of…

08.03.2026
In the cinematic masterpiece Rocky IV, Rocky gets dazed by his opponent, Captain Ivan Drago, and complains that he sees…
07.27.2026
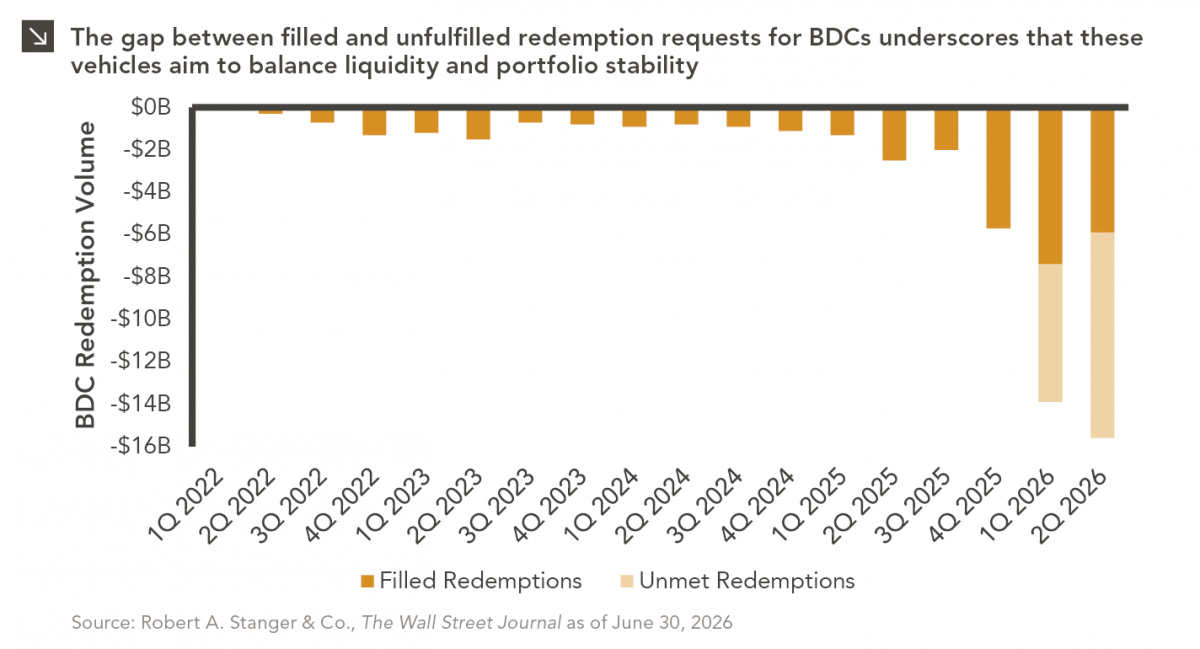
The rapid growth of non-traded business development companies (BDCs), which are investment vehicles that pool investor capital to make loans…
Research alerts keep you updated on our latest research publications. Simply enter your contact information, choose the research alerts you would like to receive and click Subscribe. Alerts will be sent as research is published.
We respect your privacy. We will never share or sell your information.
If you have questions or need further information, please contact us directly and we will respond to your inquiry within 24 hours.
Contact Us >