Dennis Yu
Research Analyst
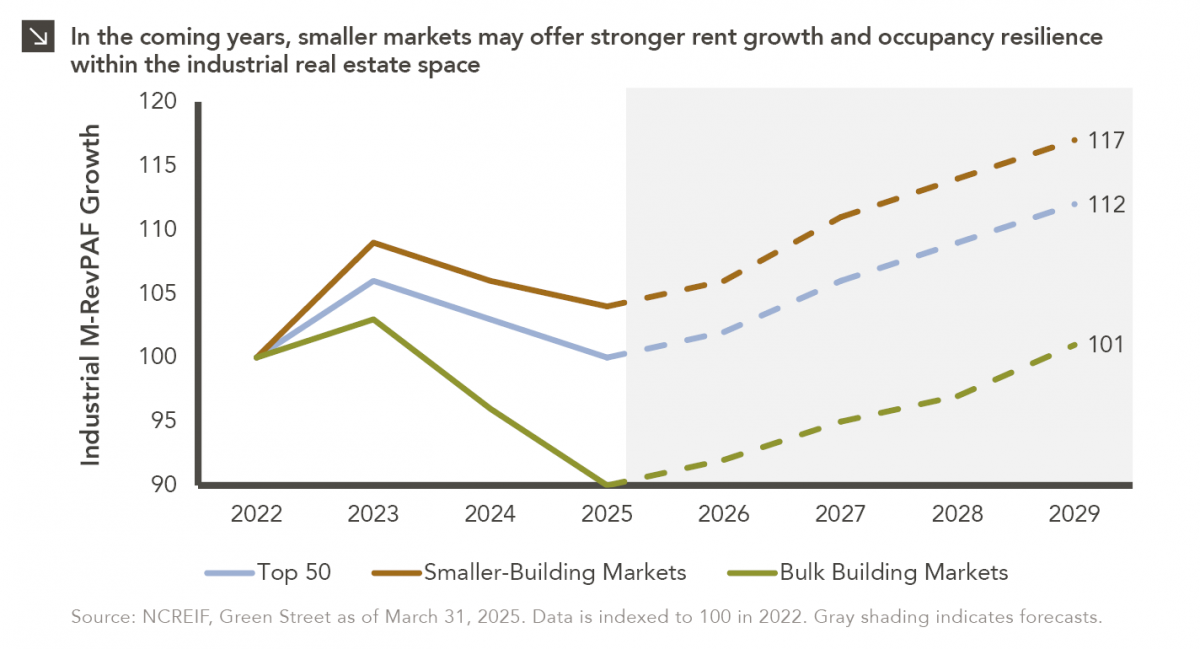
This week’s chart compares realized and expected Market Revenue per Available Foot (“M-RevPAF”) growth within the industrial real estate space across three segments: The top 50 markets, smaller-building markets, and bulk building markets. M-RevPAF blends rent and occupancy into a single metric, providing a comprehensive view of market revenue performance.
Over the past several years, elevated new supply in low-barrier bulk distribution markets has pressured occupancy and rents, causing this segment to lag both smaller-building markets and the Top 50 diversified index. That gap is expected to widen further by 2029, as smaller-building markets are projected to deliver roughly five percentage points of additional cumulative revenue growth relative to bulk markets. For instance, smaller-building markets like those in infill and supply-constrained areas such as South Florida are positioned to capture stronger rent growth and maintain higher occupancy rates due to demand dynamics and limited new deliveries. Conversely, bulk distribution markets are still digesting significant deliveries from the 2021-2023 development cycle, which may keep vacancies elevated and rent growth muted for several years.
These forecasts highlight the potential for a meaningful divergence in performance across industrial subsectors, stressing the need for discipline and precision when it comes to capital allocation by asset managers. Allocations toward smaller markets can help enhance portfolio resilience and capture outperformance relative to bulk distribution markets, where managers should be employing more conservative underwriting (assuming longer lease-up periods, requiring wider exit cap rates to compensate for slower NOI growth, etc.). A diversified approach that combines Top 50 markets with targeted exposures to smaller-building strategies may offer the best balance between growth and stability for investors in the years ahead.
Print PDF
The opinions expressed herein are those of Marquette Associates, Inc. (“Marquette”), and are subject to change without notice. This material is not financial advice or an offer to purchase or sell any product. Marquette reserves the right to modify its current investment strategies and techniques based on changing market dynamics or client needs.

07.27.2026
The rapid growth of non-traded business development companies (BDCs), which are investment vehicles that pool investor capital to make loans…

07.24.2026
This video is a recording of a live webinar held July 23 by Marquette’s research team analyzing the first half…

07.20.2026
Our most recent Chart of the Week publication discussed how the AI investment opportunity has expanded beyond…

07.13.2026
One of the enduring lessons of the California Gold Rush is that the greatest fortunes were often made not by…

07.06.2026
Since traditional exit routes have remained constrained in recent years due to higher interest rates, valuation gaps, and a subdued…

06.29.2026
This week’s chart highlights the varying return profiles across key infrastructure sectors by illustrating the split between income and capital…
Research alerts keep you updated on our latest research publications. Simply enter your contact information, choose the research alerts you would like to receive and click Subscribe. Alerts will be sent as research is published.
We respect your privacy. We will never share or sell your information.
If you have questions or need further information, please contact us directly and we will respond to your inquiry within 24 hours.
Contact Us >