09.08.2026
EMD’s Second Chance?
Over the last several years, emerging market debt (EMD) has faced several headwinds, with rising yields across other fixed income…


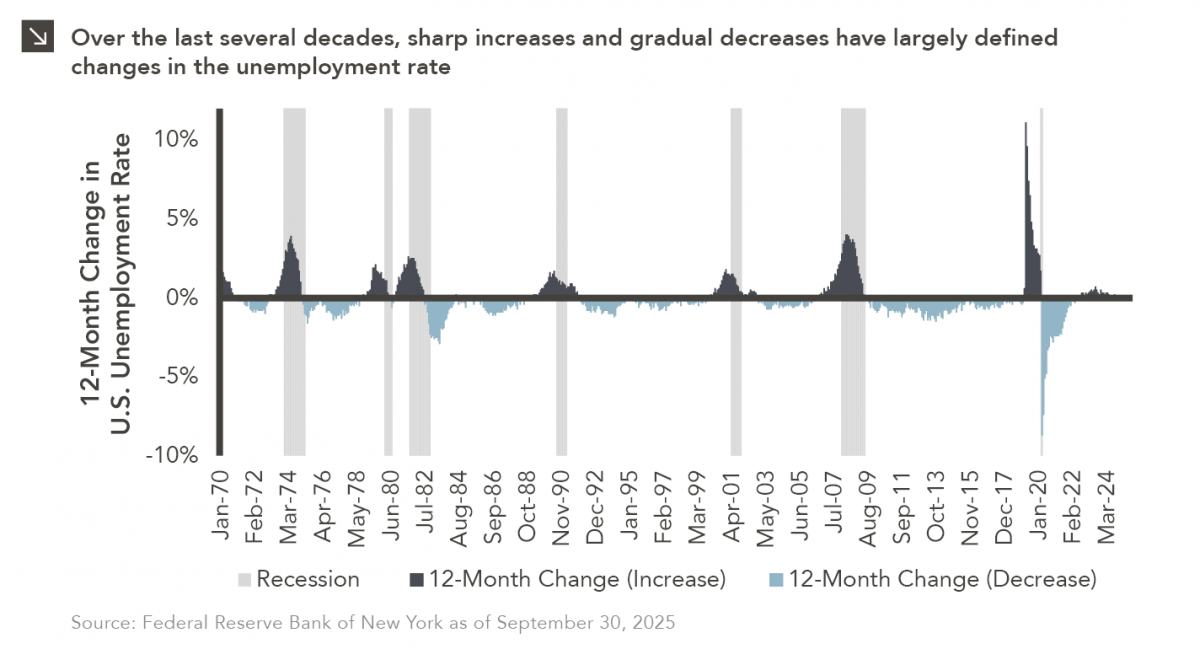
A fundamental characteristic of U.S. labor markets is the pronounced asymmetry in unemployment dynamics, as joblessness rises anywhere from three to five times faster during recessions than it falls during recoveries. This “sawblade” pattern has important implications for economic forecasting, monetary policy, and investment portfolio positioning. Amid recessionary conditions in the early 1980s, unemployment surged from 7.0% to 10.8% in just 16 months (an average increase of more than 0.2% per month). The subsequent recovery took 54 months, with unemployment declining at a rate of less than 0.1% each month on average. The Global Financial Crisis of 2008 exemplifies this pattern even more dramatically, as unemployment jumped from 5.0% to 10.0% in 22 months and normalized over a period of more than six years, during which time millions of workers faced extended joblessness. Most striking was the COVID-19 pandemic of 2020, when unemployment exploded from 3.5% to 14.7% in just two months (the sharpest spike in modern American history). While the initial recovery was faster than historical norms due to unprecedented fiscal and monetary stimulus, the unemployment rate still took 33 months to return to pre-pandemic levels. This illustrates that even with extraordinary policy support, labor market normalization remains gradual. The pattern described above reflects fundamental labor market frictions. On one hand, companies can execute mass layoffs within weeks when facing existential threats or demand shocks. At the same time, hiring is usually carried out with caution, as firms slowly restaff as confidence improves, workers require time to locate appropriate positions, and many require retraining for structural shifts in demand. Indeed, this friction is not a policy bug but rather a feature of how the labor market functions.
Understanding unemployment asymmetry is critical for investors today as the Federal Reserve navigates an increasingly complex challenge related to its dual mandate of stable prices and maximum employment. Specifically, the Fed faces an unprecedented data vacuum due to the recent government shutdown, and traditional labor market indicators are sending mixed signals. For instance, payroll growth has moderated but remains positive, initial jobless claims are elevated but have not reached recessionary levels, and the unemployment rate has risen yet remains relatively low. Some have also linked the rise of artificial intelligence to recent hiring trends, though it remains unclear whether these trends represent a meaningful secular shift in labor demand. Complications are intensified by inflation that remains stubbornly above the Fed’s 2% target. In short, looser monetary policy could lead to even higher price levels, while restrictive policy could trigger higher unemployment if actual labor market conditions are worse than available data points suggest.
Going forward, the Fed will likely be forced to prioritize one side of its dual mandate over the other, as interest rate policy is too blunt an instrument to fine-tune both price and employment levels simultaneously. The current environment represents precisely the knife-edge scenario in which an understanding of asymmetric labor dynamics becomes essential for economic forecasting.
Print PDFThe opinions expressed herein are those of Marquette Associates, Inc. (“Marquette”), and are subject to change without notice. This material is not financial advice or an offer to purchase or sell any product. Marquette reserves the right to modify its current investment strategies and techniques based on changing market dynamics or client needs.

09.08.2026
Over the last several years, emerging market debt (EMD) has faced several headwinds, with rising yields across other fixed income…

08.31.2026
Private equity has always had a few portfolio companies that refused to leave the party. Today, however, the industry appears…

08.24.2026
The global bond market is facing renewed pressure as investors demand higher yields to hold long-dated government debt, pushing borrowing…

08.17.2026
As a college football player struggling to put on mass, the “supersizing” deal at McDonald’s was hard to beat. For…

08.10.2026
After reaching nearly ¥164 per dollar, its weakest level in roughly four decades, the yen had become a source of…

08.03.2026
In the cinematic masterpiece Rocky IV, Rocky gets dazed by his opponent, Captain Ivan Drago, and complains that he sees…
Research alerts keep you updated on our latest research publications. Simply enter your contact information, choose the research alerts you would like to receive and click Subscribe. Alerts will be sent as research is published.
We respect your privacy. We will never share or sell your information.
If you have questions or need further information, please contact us directly and we will respond to your inquiry within 24 hours.
Contact Us >