Evan Frazier, CFA, CAIA
Senior Research Analyst


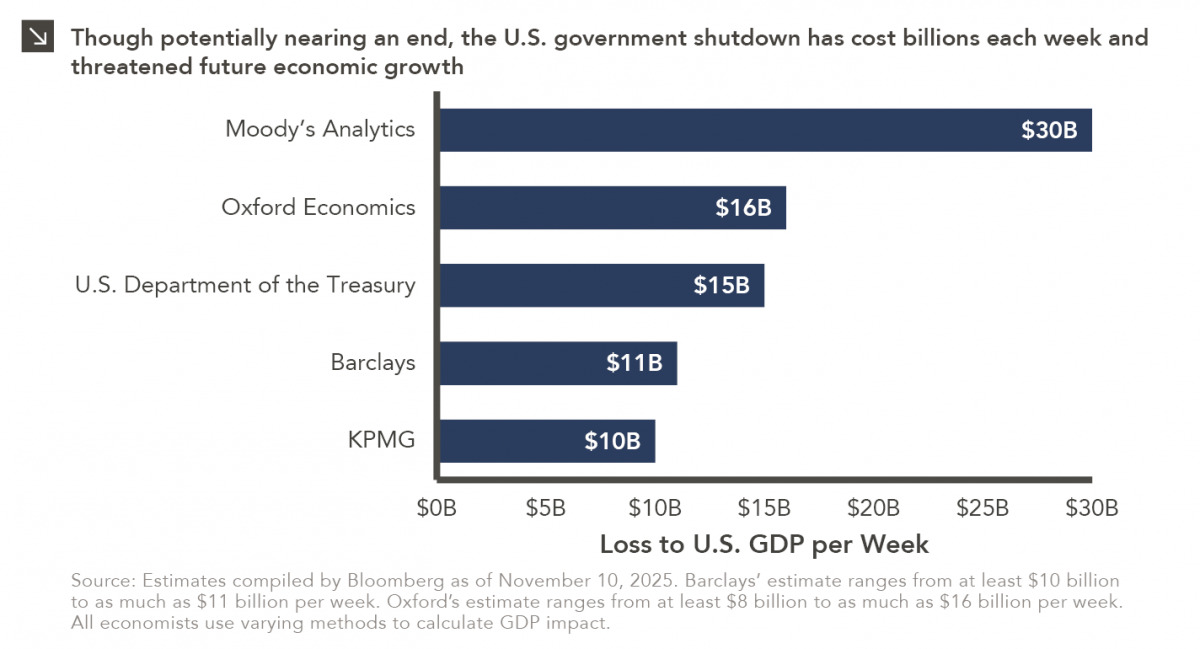
Over the weekend, the Senate overcame a key procedural obstacle in its attempt to end the record-breaking government shutdown, as enough Democrats agreed to advance a bill aimed at resolving the weeks-long stalemate. While previous government shutdowns have only caused short-term economic impacts since furloughed employees eventually receive back pay and federal spending typically rebounds quickly once operations resume, experts warn that the current shutdown has proved more damaging for several reasons. First, the economy is in a more vulnerable position than it was during previous closures, with households already strained by inflation and labor market uncertainty. Additionally, the current impasse has affected not only federal employees but also millions of Americans who are seeing their food assistance disrupted just as the holiday season approaches. As can be seen in this week’s chart, analysts estimate that the shutdown has cost the U.S. economy anywhere from $10 billion to $30 billion per week, with total losses already surpassing those of any previous government closure.
Looking ahead, economists note that while some of the output lost to the shutdown might eventually be recovered once the government reopens, a growing share (particularly in private sector services and tourism) will likely be permanent. The Congressional Budget Office warns that the shutdown could shave as much as two percentage points off fourth-quarter GDP growth, threatening to amplify existing weaknesses in manufacturing and consumer sentiment. Forecasts from major financial institutions have also been revised downward in recent days, with many groups citing rising uncertainty over fiscal policy and declining confidence. As it relates to capital markets, previous government shutdowns have had little impact on equity performance, with the S&P 500 Index averaging a return of roughly 1.5% during closures dating back to the 1980s and generating a positive return in 8 of the last 10 shutdowns. While these figures suggest that investors have largely considered past shutdowns insignificant, economic fallout and weaker sentiment stemming from the current closure could weigh on stocks going forward. For reference, the S&P 500 Index has returned roughly 0.7% since the shutdown began on October 1 through the end of last week, despite four days that saw the benchmark drop by nearly 1% during the period.
Print PDF
The opinions expressed herein are those of Marquette Associates, Inc. (“Marquette”), and are subject to change without notice. This material is not financial advice or an offer to purchase or sell any product. Marquette reserves the right to modify its current investment strategies and techniques based on changing market dynamics or client needs.

10.12.2026
This week’s chart highlights the accelerating growth of electricity demand in the U.S., which has been driven primarily by the…

10.08.2026
LIVE WEBINAR — OCTOBER 22 Please join Marquette’s research team for our 3Q 2026 Market Insights Webinar…

10.05.2026
For investors, the spookiest thing about October might not be the ghosts and monsters that are bound to show up…

09.28.2026
The phrase “expectations of higher inflation” has become a staple in financial news to explain the increase in nominal U.S….

09.21.2026
For much of the past several years, the conventional view has been that higher interest rates and stretched valuations would…

09.14.2026
There are many great things about working at Marquette Associates, but “Free Lunch Tuesday” is right at the top of…
Research alerts keep you updated on our latest research publications. Simply enter your contact information, choose the research alerts you would like to receive and click Subscribe. Alerts will be sent as research is published.
We respect your privacy. We will never share or sell your information.
If you have questions or need further information, please contact us directly and we will respond to your inquiry within 24 hours.
Contact Us >