Catherine Hillier
Senior Research Analyst
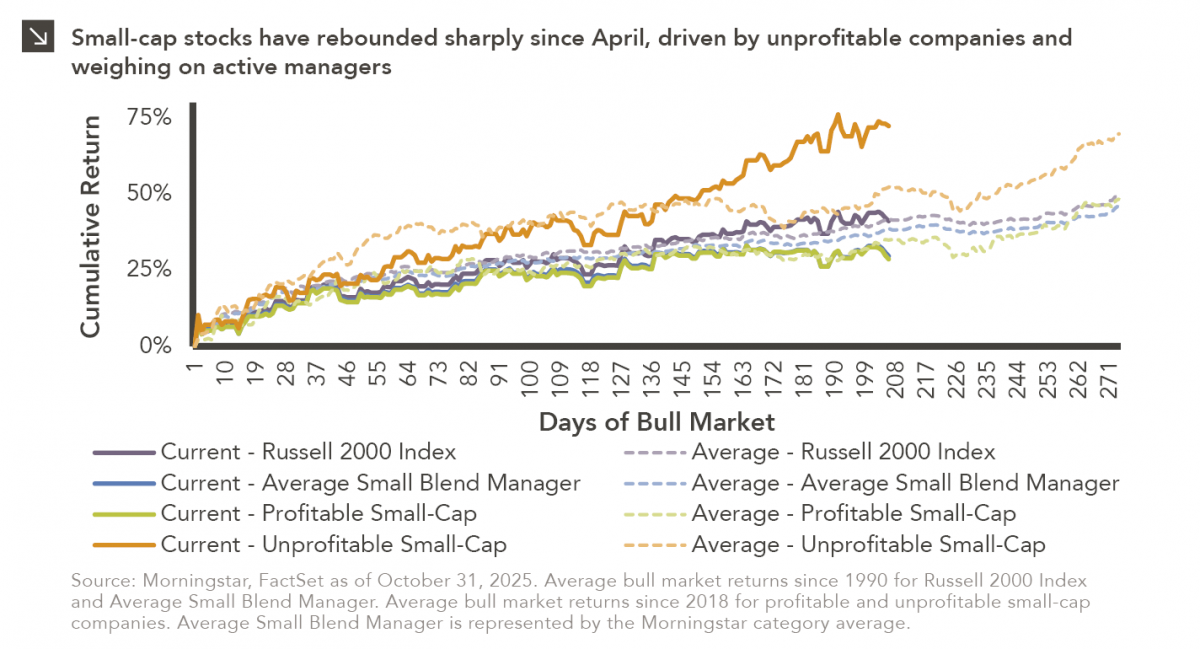
Small-cap equities are in a prolonged period of underperformance relative to large-cap stocks, but this trend has shown early signs of reversing in the aftermath of intra-year market lows on April 8, with the Russell 2000 Index up roughly 41% since that time. Interestingly, unprofitable companies within the benchmark have led the way, gaining more than 72% compared to a relatively meager 29% for profitable constituents of the Russell 2000 Index. Although the overall small-cap equity market is currently in line with its average bull market return amid this run, recent performance of unprofitables far exceeds historical norms. This dynamic can be observed in the chart above.
One of the major consequences of this trend is significant underperformance of actively managed small-cap strategies, which typically eschew companies with poor fundamentals. Specifically, the average active small-cap blend manager (as represented by the Morningstar category average) has underperformed the Russell 2000 Index by more than 10 percentage points since April 8, an extreme not seen in roughly 25 years. On the positive side, active small-cap strategies have slightly outperformed profitable small-cap companies, which are more likely to be included in these types of funds. Should this persist, it may be a tailwind for active managers, as profitable companies may have additional upside from here based on trends observed in prior bull markets. That said, more accommodative monetary policy and fiscal support may lead to additional strength from unprofitables and, as a result, further underperformance of active managers.
Print PDF
The opinions expressed herein are those of Marquette Associates, Inc. (“Marquette”), and are subject to change without notice. This material is not financial advice or an offer to purchase or sell any product. Marquette reserves the right to modify its current investment strategies and techniques based on changing market dynamics or client needs.

07.27.2026
The rapid growth of non-traded business development companies (BDCs), which are investment vehicles that pool investor capital to make loans…

07.24.2026
This video is a recording of a live webinar held July 23 by Marquette’s research team analyzing the first half…
07.22.2026
The usual midyear version of these letters has touched on year-to-date performance as well as the most influential macroeconomic and…

07.20.2026
Our most recent Chart of the Week publication discussed how the AI investment opportunity has expanded beyond…

07.13.2026
One of the enduring lessons of the California Gold Rush is that the greatest fortunes were often made not by…

07.06.2026
Since traditional exit routes have remained constrained in recent years due to higher interest rates, valuation gaps, and a subdued…
Research alerts keep you updated on our latest research publications. Simply enter your contact information, choose the research alerts you would like to receive and click Subscribe. Alerts will be sent as research is published.
We respect your privacy. We will never share or sell your information.
If you have questions or need further information, please contact us directly and we will respond to your inquiry within 24 hours.
Contact Us >