James Torgerson
Senior Research Analyst
To paraphrase a quote from former President George W. Bush: “Fool me once, shame on… shame on you. Fool me — you can’t get fooled again.” This botched attempt at quoting the common phrase aside, the below-investment grade market shows that it can, in fact, get fooled again. High-profile defaults from subprime auto lender Tricolor and auto parts manufacturer First Brands have recently made waves, but additional default trends exist below the hood (automotive pun intended) and are currently flying under the radar.
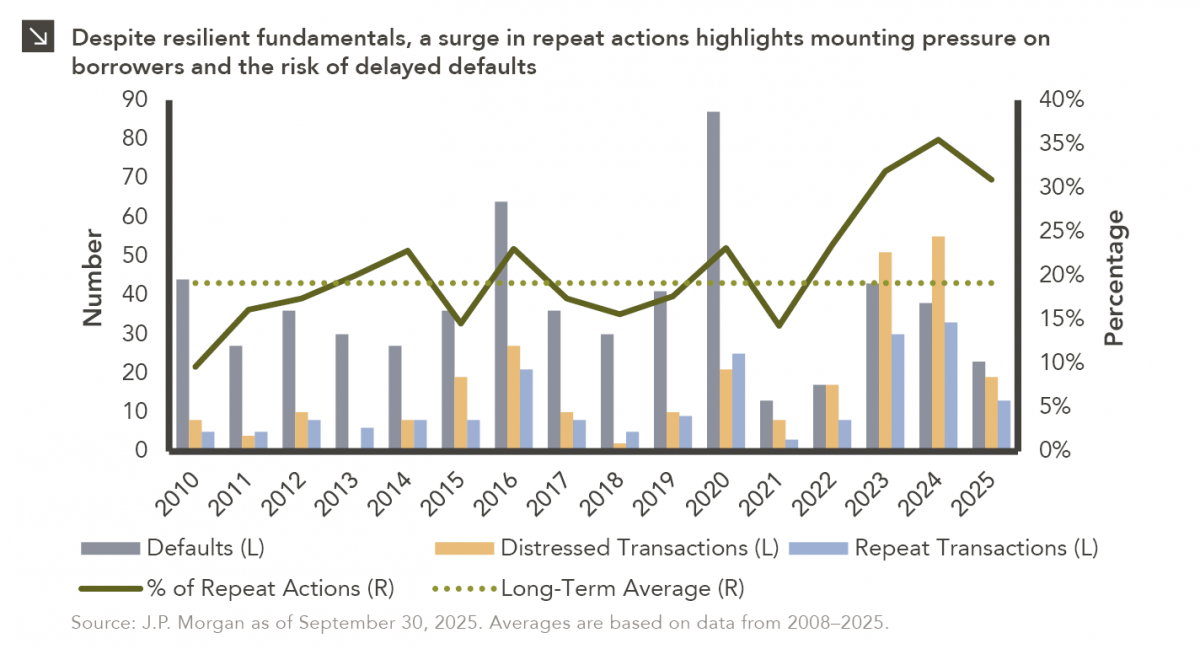
This week’s chart shows a meaningful increase in the percentage of leveraged credit borrowers conducting repeat distressed and default actions. A repeat action is defined as when a borrower that has previously undergone a distressed transaction or default undergoes either another distressed transaction, defaults after a distressed transaction, or defaults again. Since 2008, an average of 19% of borrowers who underwent either a distressed transaction or default went on to conduct a repeat action according to J.P. Morgan. This figure has increased meaningfully to 33% since the beginning of 2023. There are many factors fueling this increase, including a sustained environment of higher interest rates and the increased desire of lenders to recoup portions of their investments. However, repeat actions don’t have favorable outcomes for all parties, as approximately 72% ultimately end in the borrower defaulting. While a repeat transaction can serve as a lifeline to a stressed borrower, it typically just ends up “kicking the can” on the eventual default.
Broadly, headline defaults remain below or near long-term averages within leveraged credit, even when incorporating distressed transactions. Additionally, leveraged credit fundamentals remain resilient. The high yield bond market is now of significantly higher quality than it has been historically, as some of the lowest quality borrowers in the space have opted to transact in private markets. Additionally, interest costs should begin to ease for borrowers as the Federal Reserve continues its easing cycle. However, the increase in repeat actions shows that the most stressed borrowers remain under pressure and are trying to delay defaults as long as possible. This is a dynamic that certainly bears monitoring. Going forward, while additional defaults like First Brands may generate headlines, idiosyncratic developments likely won’t offset a fundamental environment that has not shown broad-based deterioration. Some may get fooled, but the key is to not get fooled again.
Print PDF
The opinions expressed herein are those of Marquette Associates, Inc. (“Marquette”), and are subject to change without notice. This material is not financial advice or an offer to purchase or sell any product. Marquette reserves the right to modify its current investment strategies and techniques based on changing market dynamics or client needs.

07.27.2026
The rapid growth of non-traded business development companies (BDCs), which are investment vehicles that pool investor capital to make loans…

07.24.2026
This video is a recording of a live webinar held July 23 by Marquette’s research team analyzing the first half…
07.22.2026
The usual midyear version of these letters has touched on year-to-date performance as well as the most influential macroeconomic and…

07.20.2026
Our most recent Chart of the Week publication discussed how the AI investment opportunity has expanded beyond…

07.13.2026
One of the enduring lessons of the California Gold Rush is that the greatest fortunes were often made not by…

07.06.2026
Since traditional exit routes have remained constrained in recent years due to higher interest rates, valuation gaps, and a subdued…
Research alerts keep you updated on our latest research publications. Simply enter your contact information, choose the research alerts you would like to receive and click Subscribe. Alerts will be sent as research is published.
We respect your privacy. We will never share or sell your information.
If you have questions or need further information, please contact us directly and we will respond to your inquiry within 24 hours.
Contact Us >