Thomas Neuhardt
Associate Research Analyst
Get to Know Thomas
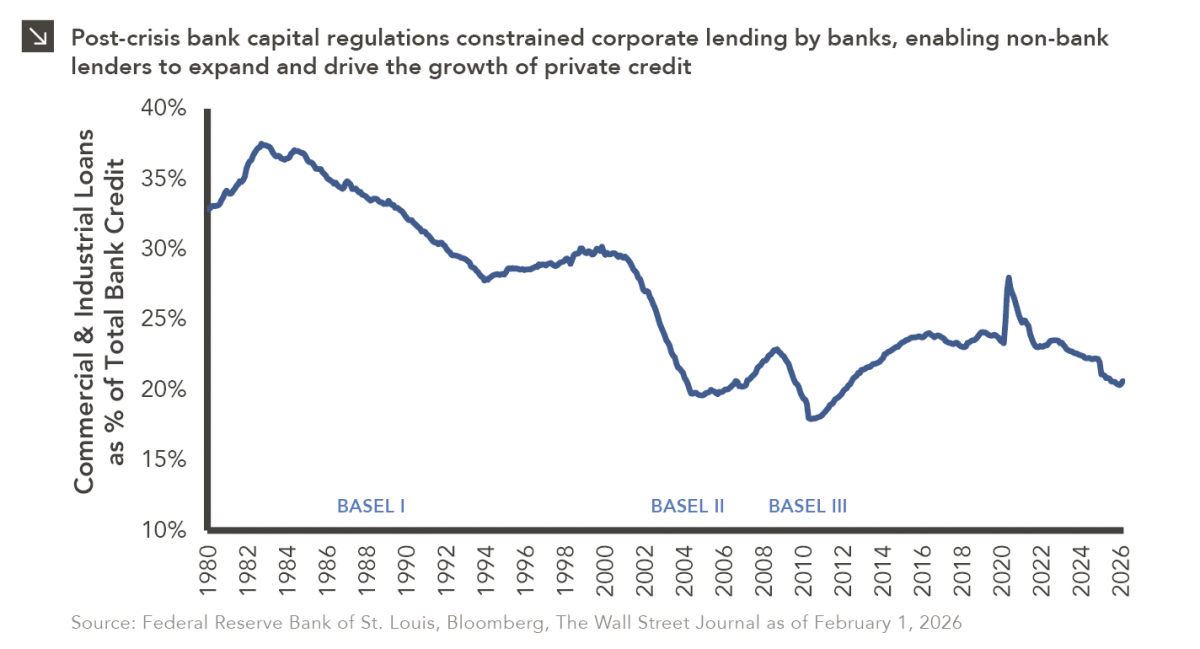
The Basel capital framework was created to ensure that banks maintain sufficient capital to absorb losses and reduce the risk of systemic financial instability, thereby strengthening the resilience of the global banking system. Basel I established minimum capital requirements for banks based primarily on credit risk to strengthen the stability of the international banking system, while Basel II refined the framework by introducing more risk-sensitive capital requirements and supervisory oversight to better align bank capital with the actual risks banks take. In response to the Global Financial Crisis, during which Basel II ultimately proved insufficient, Basel III significantly increased capital, liquidity, and stress‑testing requirements. While these reforms improved financial stability, they also raised the cost of holding corporate loans on bank balance sheets, contributing to a sustained decline in corporate lending as a share of total bank credit after 2008. This dynamic can be observed in the chart above. As bank balance sheet capacity for corporate lending became more constrained, non-bank lenders increasingly stepped in to provide direct financing to companies, helping to fuel the growth of the private credit asset class. A proposed Basel III “Endgame” overhaul in 2023 would have further increased capital requirements, but this overhaul was ultimately shelved amid industry pushback and concerns that new rules would have been onerous.
Last month, U.S. regulators unveiled a proposed update to bank capital rules, marking a notable recalibration of the post‑crisis regulatory framework. The proposal would ease several elements of the existing framework, including aspects of Basel III implementation, the Global Systemically Important Bank (G‑SIB) surcharge, leverage requirements, and stress‑testing assumptions. Policymakers acknowledged that earlier rounds of post‑crisis regulation, while successful in strengthening the financial system, may have unintentionally constrained banks in terms of their ability to intermediate credit (particularly to businesses) and encouraged lending activity to migrate outside the regulated banking network. New proposals seek to preserve a robust capital framework while helping banks better support corporate lending on their balance sheets and compete more effectively with non-bank lenders.
Easing capital constraints could allow banks to re‑enter certain segments of the corporate lending market, particularly lower‑risk or relationship‑driven spaces, which may help stabilize or modestly increase the share of bank balance sheets allocated to corporate loans. However, private lenders retain structural advantages, including speed of execution, flexibility in deal structuring, and a greater willingness to finance bespoke or higher‑risk situations (areas banks are unlikely to fully re‑enter even with modest capital relief). As a result, competition may increase at the margin for more standardized corporate credit, potentially tightening spreads and slowing incremental share gains for private credit. Overall, the proposed changes may reduce the pace of disintermediation, but they do not undo the long‑term structural shift away from bank‑dominated corporate lending highlighted in this week’s chart.
Print PDF
The opinions expressed herein are those of Marquette Associates, Inc. (“Marquette”), and are subject to change without notice. This material is not financial advice or an offer to purchase or sell any product. Marquette reserves the right to modify its current investment strategies and techniques based on changing market dynamics or client needs.

06.15.2026
The rapid buildout of artificial intelligence infrastructure is reshaping the U.S. investment landscape. According to recent Census Bureau data, spending…

06.08.2026
Hi, James Torgerson here! Volatility can be an unsightly blemish on portfolios and lead to inferior risk-adjusted returns. Private credit…

06.01.2026
The MSCI Emerging Markets Index has undergone a significant structural transformation in recent years. For much of the past decade,…

05.26.2026
The classic novel A Tale of Two Cities by Charles Dickens begins with the line “It was the best of…

05.18.2026
Over the last few years, equity markets have been defined by a group of stocks often referred to as the…

05.11.2026
In addition to the humanitarian toll of the conflict in Iran, the world is currently confronting the impact that trade…
Research alerts keep you updated on our latest research publications. Simply enter your contact information, choose the research alerts you would like to receive and click Subscribe. Alerts will be sent as research is published.
We respect your privacy. We will never share or sell your information.
If you have questions or need further information, please contact us directly and we will respond to your inquiry within 24 hours.
Contact Us >