Evan Frazier, CFA, CAIA
Senior Research Analyst
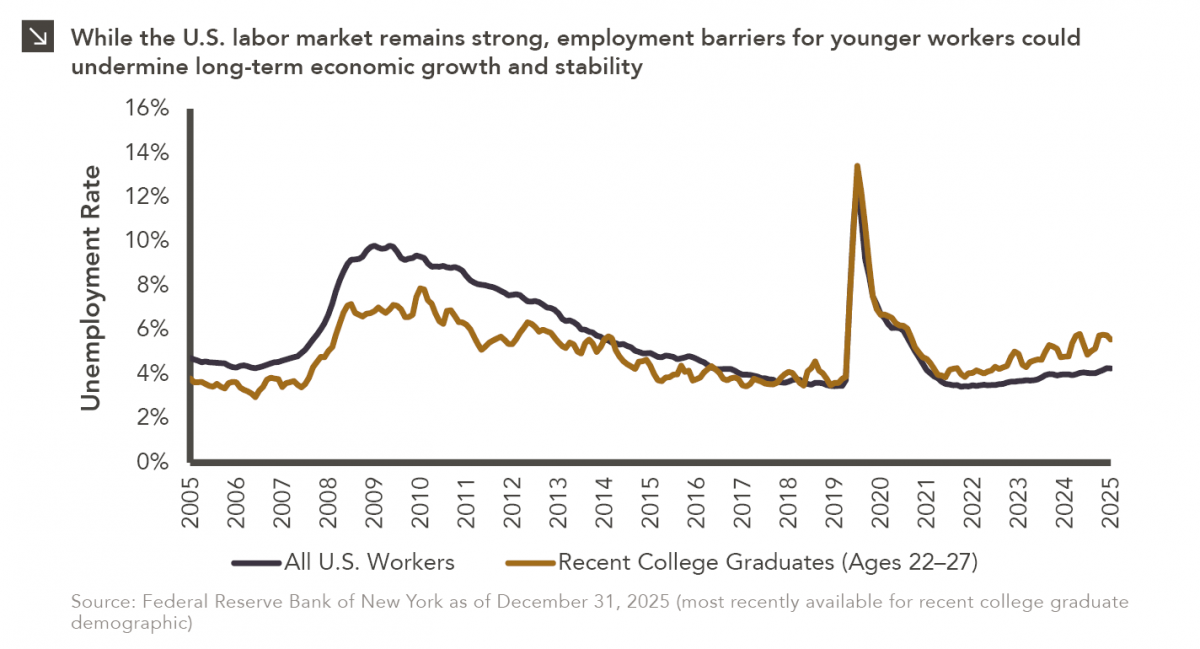
Entry-level jobs have traditionally served as the primary bridge between education and stable employment, offering young workers a foothold from which to build skills and careers. That bridge now appears to be in a precarious position, however, as data points show that unemployment among recent college graduates has risen meaningfully in just a few years (even as headline labor market indicators remain relatively stable). Indeed, the unemployment rate for recent college graduates was 5.6% at the end of last year, compared to a more moderate figure of 4.2% for the entire United States.
Several factors could explain this situation. First, the nature of entry-level work is changing, as positions that once required little experience increasingly demand that applicants possess prior skills, internships, or even several years of relevant work. This dynamic leaves many new graduates caught in a paradox: unable to gain experience because they lack it. Hiring trends reinforce this challenge. Employer demand for early-career talent has flattened, and companies appear more reluctant to invest in training, instead favoring candidates who can contribute immediately. The result is a bottleneck at the bottom of the labor market, where supply continues to grow but opportunities do not keep pace. Broader economic forces are compounding these pressures. Technological change, particularly the increasing adoption of automation and artificial intelligence, is reshaping the types of tasks firms are willing to assign to junior workers. In many cases, routine or entry-level responsibilities are being automated or consolidated into higher-skill roles. At the same time, hiring has become more selective and uneven across industries, with growth concentrated in sectors that are less accessible to many recent graduates. Research from regional Federal Reserve banks underscores that these trends are not merely cyclical but may reflect longer-term shifts in how labor markets function. When entry-level hiring weakens, career progression slows, wage growth is delayed, and workforce participation may decline as discouraged workers step back from job searches. Over time, this can erode productivity and limit economic dynamism, as fewer workers gain the early-career experience needed to move into more advanced roles. The implications extend beyond individual job seekers to the broader economy, which depends on a steady pipeline of talent development.
Taken together, these dynamics point to a labor market that is still strong on the surface but potentially fragile beneath it. A robust economy is not defined solely by low unemployment or steady job creation, but also by the accessibility of opportunity across all stages of a worker’s career. Ensuring a sufficient supply of true entry-level roles (i.e., positions that offer training, mobility, and a pathway forward) may therefore be critical not just for today’s graduates, but for sustaining long-term economic growth.
Print PDF
The opinions expressed herein are those of Marquette Associates, Inc. (“Marquette”), and are subject to change without notice. This material is not financial advice or an offer to purchase or sell any product. Marquette reserves the right to modify its current investment strategies and techniques based on changing market dynamics or client needs.

06.22.2026
When Benchmark, one of Silicon Valley’s most renowned early-stage venture capital firms, closed $2 billion across two new funds this…

06.15.2026
The rapid buildout of artificial intelligence infrastructure is reshaping the U.S. investment landscape. According to recent Census Bureau data, spending…

06.08.2026
Hi, James Torgerson here! Volatility can be an unsightly blemish on portfolios and lead to inferior risk-adjusted returns. Private credit…

06.01.2026
The MSCI Emerging Markets Index has undergone a significant structural transformation in recent years. For much of the past decade,…

05.26.2026
The classic novel A Tale of Two Cities by Charles Dickens begins with the line “It was the best of…

05.18.2026
Over the last few years, equity markets have been defined by a group of stocks often referred to as the…
Research alerts keep you updated on our latest research publications. Simply enter your contact information, choose the research alerts you would like to receive and click Subscribe. Alerts will be sent as research is published.
We respect your privacy. We will never share or sell your information.
If you have questions or need further information, please contact us directly and we will respond to your inquiry within 24 hours.
Contact Us >