06.08.2026
How to Launder Your Volatility
Hi, James Torgerson here! Volatility can be an unsightly blemish on portfolios and lead to inferior risk-adjusted returns. Private credit…
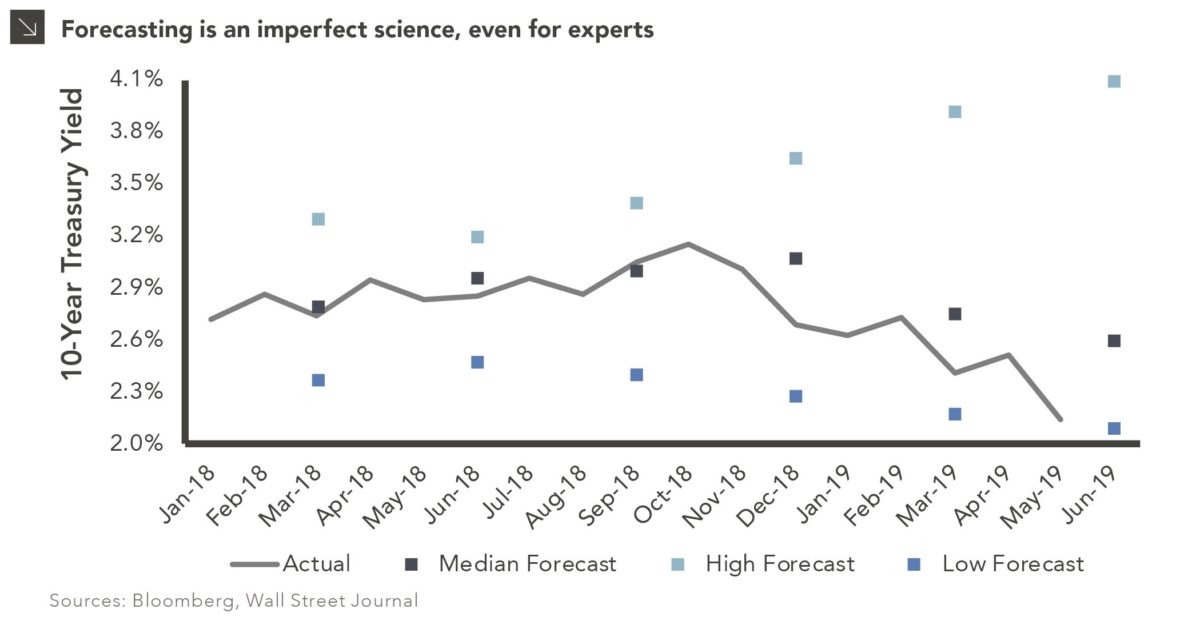
Since the end of October, the yield on the 10-year Treasury fell more than 1% and as of writing stands at 2.12%. The drop resulted in the yield curve inverting between the 3-month and 10-year maturities, and the 2-year yield is getting dangerously close to also surpassing the 10-year. This dramatic decline and inversion made investors nervous that a recession was on the horizon and caught most economists off-guard. In both 4Q and 1Q the 10-year yield ended lower than the average forecast from the Bloomberg consensus by about 0.4%. 2Q is on track to be even worse as the yield may fall below the forecasted low from the survey.
Towards the end of 2018, most believed the 10-year would rise thanks to continued growth and further rate hikes by the Fed. However, volatility and ongoing concerns about tariffs have pushed investors into safe-haven assets. This was further fueled by the weaker than expected job reports and most now believe the Fed will likely cut interest rates at least once before the end of the year. As a result, some institutions revised their forecasts for the remainder of 2019, going as low as 1.75% for the 10-year. That said, there is still a great deal of uncertainty and rates could just as easily rebound should we get more positive economic data, if the Fed chooses not to decrease rates, or if there is a resolution to the trade conflict. Overall, this serves as a reminder to investors that timing the market is an imperfect science and even experts can miss the mark by a wide margin. We continue to encourage clients to stick to their investment policies, invest for the long-term, and follow a disciplined rebalancing routine.
Print PDF > When the Experts Are Wrong
The opinions expressed herein are those of Marquette Associates, Inc. (“Marquette”), and are subject to change without notice. This material is not financial advice or an offer to purchase or sell any product. Marquette reserves the right to modify its current investment strategies and techniques based on changing market dynamics or client needs.
The opinions expressed herein are those of Marquette Associates, Inc. (“Marquette”), and are subject to change without notice. This material is not financial advice or an offer to purchase or sell any product. Marquette reserves the right to modify its current investment strategies and techniques based on changing market dynamics or client needs.

06.08.2026
Hi, James Torgerson here! Volatility can be an unsightly blemish on portfolios and lead to inferior risk-adjusted returns. Private credit…

06.01.2026
The MSCI Emerging Markets Index has undergone a significant structural transformation in recent years. For much of the past decade,…

05.26.2026
The classic novel A Tale of Two Cities by Charles Dickens begins with the line “It was the best of…

05.18.2026
Over the last few years, equity markets have been defined by a group of stocks often referred to as the…

05.11.2026
In addition to the humanitarian toll of the conflict in Iran, the world is currently confronting the impact that trade…
05.07.2026
The leadership structure of the Federal Reserve is intentionally designed to promote continuity, independence, and institutional stability across political cycles….
Research alerts keep you updated on our latest research publications. Simply enter your contact information, choose the research alerts you would like to receive and click Subscribe. Alerts will be sent as research is published.
We respect your privacy. We will never share or sell your information.
If you have questions or need further information, please contact us directly and we will respond to your inquiry within 24 hours.
Contact Us >