Evan Frazier, CFA, CAIA
Senior Research Analyst


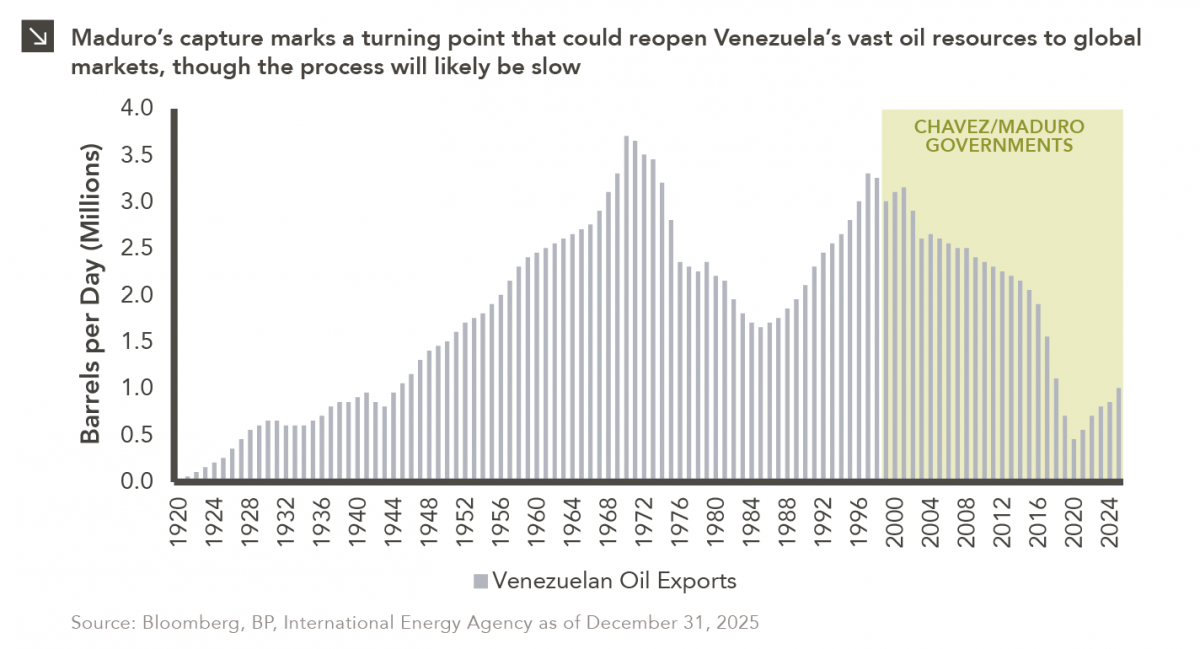
The capture of Venezuelan president Nicolás Maduro is a watershed moment for a country whose natural resource economy has been managed by an interventionist, state-centric regime for nearly 30 years. Indeed, Maduro’s detention effectively ends the command-and-control model that had long governed Venezuela’s oil sector, in which the state-owned oil company PDVSA functioned largely as a political instrument rather than a commercial enterprise. Once a technically competent producer, PDVSA was hollowed out in the early 2000s as revenues were diverted to fund government spending, skilled workers were purged, and maintenance and reinvestment were neglected. As can be seen in this week’s chart, this led to a steep decline in Venezuelan production and export capacity. For global markets, the immediate significance of the ousting of Maduro lies less in the regime change itself than in the potential reopening of one of the world’s largest hydrocarbon endowments after years of sanctions and operational decay.
In the short run, Venezuelan oil exports are likely to increase modestly but unevenly. Although the nation’s output has already started to recover from its 2020 trough due to limited sanctions waivers and ad hoc deals, infrastructure constraints remain severe. Years of deferred maintenance have left pipelines, ports, and storage facilities in poor condition, while a shortage of skilled labor and reliable power continues to limit throughput. As a result, any additional barrels reaching export markets will likely come primarily via better utilization of existing fields rather than large-scale new investment, at least over the coming months. Deals that redirect crude toward the United States (particularly heavy oil suited for Gulf Coast refineries) could shift trade flows quickly, but they do not solve the deeper structural problems of the industry. Near-term export gains are therefore likely to be measured in hundreds of thousands of barrels per day rather than a return to Venezuela’s historical multi-million-barrel output.
Over a longer time horizon, the toppling of Maduro could reshape Venezuela’s oil sector more profoundly by altering its relationship with foreign capital and global commodities markets. International oil companies have long viewed Venezuela’s reserves as attractive but effectively uninvestable due to sanctions risk, opaque governance, a history of expropriation, and weak contract enforcement. A political realignment raises the possibility of a gradual normalization of commercial terms, including joint ventures, profit-sharing mechanisms, and clearer legal protections for market participants. However, analysts widely agree that rebuilding production capacity would be a long and risky process, likely requiring tens of billions of dollars and many years of stable policy. Further complicating matters is Venezuela’s exceptionally high methane intensity, which makes its crude oil among the most emissions-intensive in the world and increasingly problematic for buyers facing stricter environmental standards. Addressing these environmental liabilities would add both cost and time to any meaningful expansion of exports.
Beyond oil, Venezuela’s broader natural resource abundance adds an additional layer of significance to the recent change in leadership. Specifically, the country sits atop substantial reserves of gold and other strategic minerals, and renewed export capacity could feed into a broader bull market in commodities if supply constraints ease. It is important to remember, however, that recent events do not automatically translate into a clean political transition, and the near-term outlook for Venezuelan commodities exports remains shaped by institutional fragility, security risks and unresolved questions about who exercises authority over production, contracts, and revenues. Ultimately, Maduro’s capture creates an opening rather than a resolution, as it increases the probability that Venezuelan resources re-enter global markets at scale, but it does not eliminate the risks that have defined the country’s commodities sector for years.
Print PDF
The opinions expressed herein are those of Marquette Associates, Inc. (“Marquette”), and are subject to change without notice. This material is not financial advice or an offer to purchase or sell any product. Marquette reserves the right to modify its current investment strategies and techniques based on changing market dynamics or client needs.

10.12.2026
This week’s chart highlights the accelerating growth of electricity demand in the U.S., which has been driven primarily by the…

10.08.2026
LIVE WEBINAR — OCTOBER 22 Please join Marquette’s research team for our 3Q 2026 Market Insights Webinar…

10.05.2026
For investors, the spookiest thing about October might not be the ghosts and monsters that are bound to show up…

09.28.2026
The phrase “expectations of higher inflation” has become a staple in financial news to explain the increase in nominal U.S….

09.21.2026
For much of the past several years, the conventional view has been that higher interest rates and stretched valuations would…

09.14.2026
There are many great things about working at Marquette Associates, but “Free Lunch Tuesday” is right at the top of…
Research alerts keep you updated on our latest research publications. Simply enter your contact information, choose the research alerts you would like to receive and click Subscribe. Alerts will be sent as research is published.
We respect your privacy. We will never share or sell your information.
If you have questions or need further information, please contact us directly and we will respond to your inquiry within 24 hours.
Contact Us >