Nat Kellogg, CFA
President


There are a variety of methods to measure market valuation but one of the simplest is to compare market capitalization to GDP. Investors can think of this as a price-to-sales multiple for the macro economy. For U.S. stocks over the last 50 years this ratio has averaged 0.76x (U.S. Market Cap/U.S. GDP). The gold line on the chart shows this ratio over the last 50 years and the dotted gold line shows the average. This simple valuation metric clearly shows the market was overvalued in 2000, and given that the market is currently valued at 1.07x U.S. GDP, stocks also look pricey today.
However, this valuation tool ignores the increasing importance of global sales and profits to U.S. firms. As many investors are aware, almost 40% of S&P 500 company profits come from overseas. The blue line shows the U.S. share of global GDP. Over the last 50 years, and particularly over the last decade, the U.S. share of global GDP has fallen to record lows, currently at just 21.5%. As the U.S. accounts for less of global GDP, U.S. GDP becomes a less relevant metric to value firms with a global reach.
As a result, global GDP may be the more relevant metric to follow. The dark gray line looks at the ratio of U.S. Market Cap to global GDP. The dotted dark gray line shows the long term average. Based on this metric, stocks were clearly cheap in the late 1970’s and early 1980’s, and expensive during the dot-com years around the turn of the century. Currently, based on global GDP, stocks do not look nearly as expensive today. In fact, stocks look fairly valued compared to their long term average.
While these metrics can act as a useful guide to broad over and under valuation in markets, they tell investors very little about where markets are headed in the short-term. However, as U.S. company sales and profits become more global, investors will increasingly want to focus on global benchmarks when looking at valuation.
The opinions expressed herein are those of Marquette Associates, Inc. (“Marquette”), and are subject to change without notice. This material is not financial advice or an offer to purchase or sell any product. Marquette reserves the right to modify its current investment strategies and techniques based on changing market dynamics or client needs.

01.26.2026
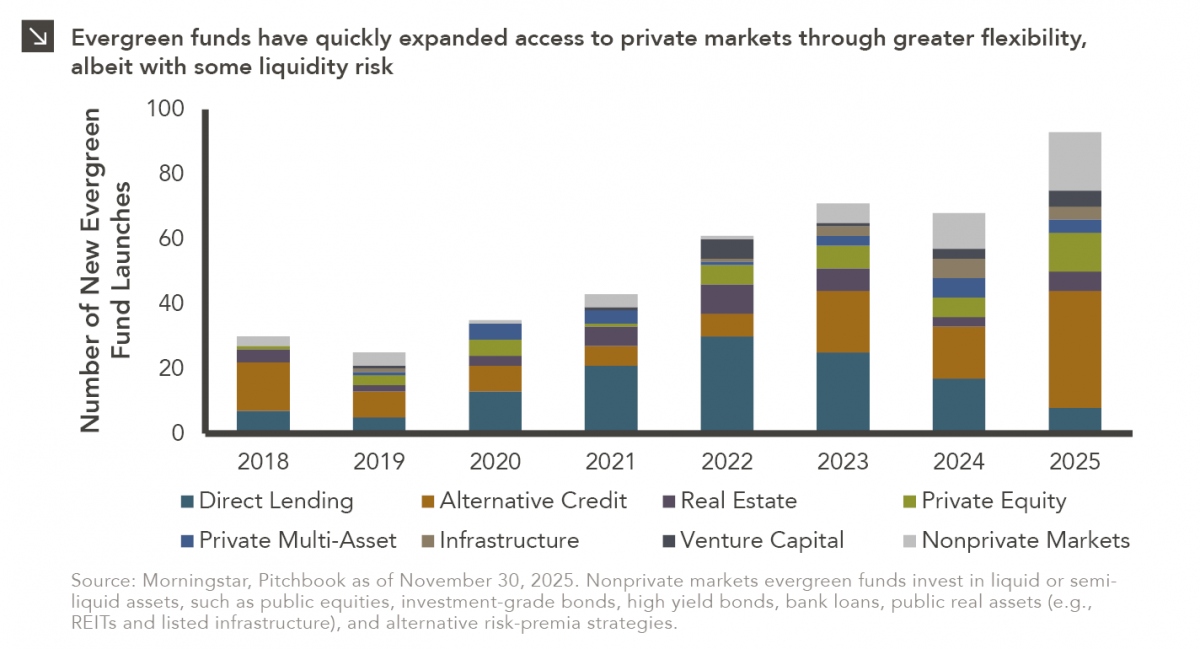
In recent years, access to traditionally illiquid private markets has expanded through the rapid growth of evergreen funds, which provide…
01.22.2026
Anyone who has gone snowmobiling knows it can be simultaneously exhilarating and terrifying. Throttling across snow and through a forest…

01.20.2026
Last week, Alphabet joined NVIDIA, Microsoft and Apple as the only companies to ever reach a market capitalization of $4…

01.07.2026
This video is a recording of a live webinar held January 15 by Marquette’s research team analyzing 2025 across the…

01.12.2026
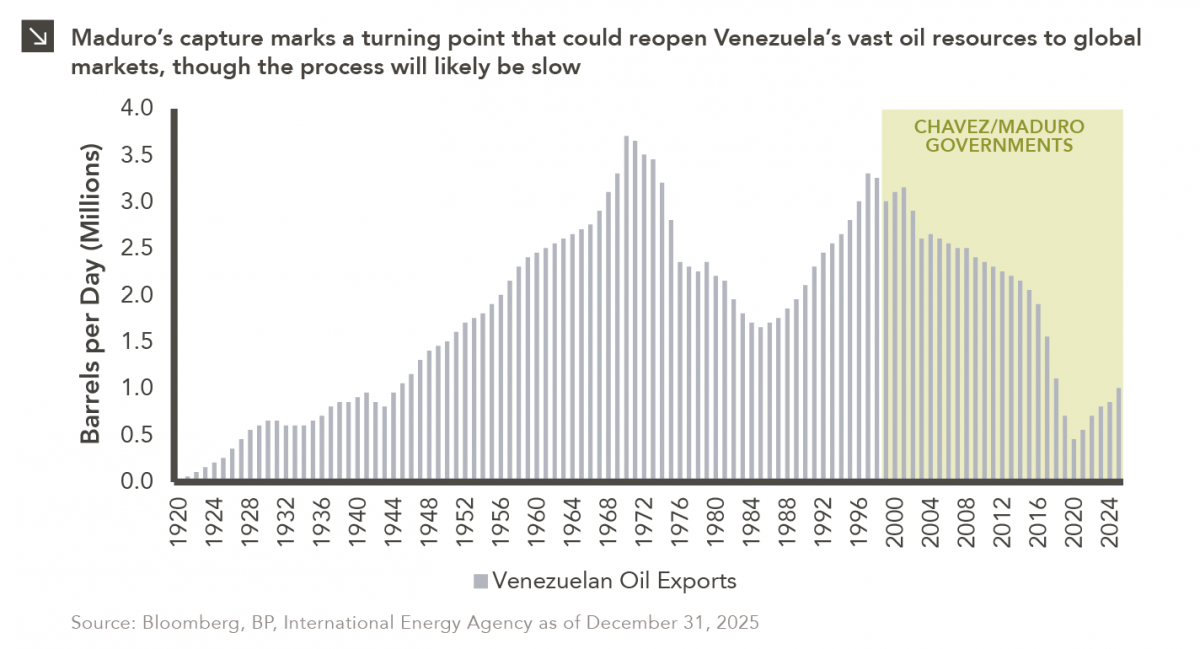
The capture of Venezuelan president Nicolás Maduro is a watershed moment for a country whose natural resource economy has been…

01.05.2026
The development of artificial intelligence is advancing along two largely distinct paths. The first centers on generative AI powered by…
Research alerts keep you updated on our latest research publications. Simply enter your contact information, choose the research alerts you would like to receive and click Subscribe. Alerts will be sent as research is published.
We respect your privacy. We will never share or sell your information.
If you have questions or need further information, please contact us directly and we will respond to your inquiry within 24 hours.
Contact Us >