07.24.2026
2026 Halftime Market Insights
This video is a recording of a live webinar held July 23 by Marquette’s research team analyzing the first half…


Liquid alternative1 assets, as defined by Morningstar, have continued to grow since 2009 and by the end of 2014, reached nearly $158 billion, up 11% from the previous year. The top 2014 fund flows within Morningstar’s liquid alternative category were concentrated across multi-alternatives (+$9.8B), long/short equity (+$6.5B), and managed futures strategies (+$2.3B). Additionally, multi-alternative flows have already totaled $1 billion in the first month of 2015, continuing to lead all other categories.
Before jumping on the bandwagon, it is important to take a step back and analyze how some of the liquid alternative strategies have performed compared to their private counterparts. Although not an exact apples-to-apples comparison, this week’s chart of the week compares the growth of $1 since January 2000 of the HFR equity hedge index (private) vs. the Morningstar long/short category (liquid). Interestingly, while the liquid long/short equity strategies outperformed private HFR equity hedge from early 2001 through mid-2003, private funds have beaten their liquid counterparts by a significant margin over the long run. Although liquid alternatives offer an attractive liquidity profile, they come with all the restrictions of a 40 Act mutual fund which limit illiquid holdings and leverage. When it comes to investing in alternative strategies, this is one reason we believe that private vehicles are most appropriate for institutional investors.
1Liquid alternatives encompass non-traditional investment strategies or asset classes (beyond equities and bonds) such as REITs, MLPs, commodities, currencies, distressed debt, or hedge fund strategies in a mutual fund format.
The opinions expressed herein are those of Marquette Associates, Inc. (“Marquette”), and are subject to change without notice. This material is not financial advice or an offer to purchase or sell any product. Marquette reserves the right to modify its current investment strategies and techniques based on changing market dynamics or client needs.

07.24.2026
This video is a recording of a live webinar held July 23 by Marquette’s research team analyzing the first half…

07.22.2026
The usual midyear version of these letters has touched on year-to-date performance as well as the most influential macroeconomic and…
07.20.2026
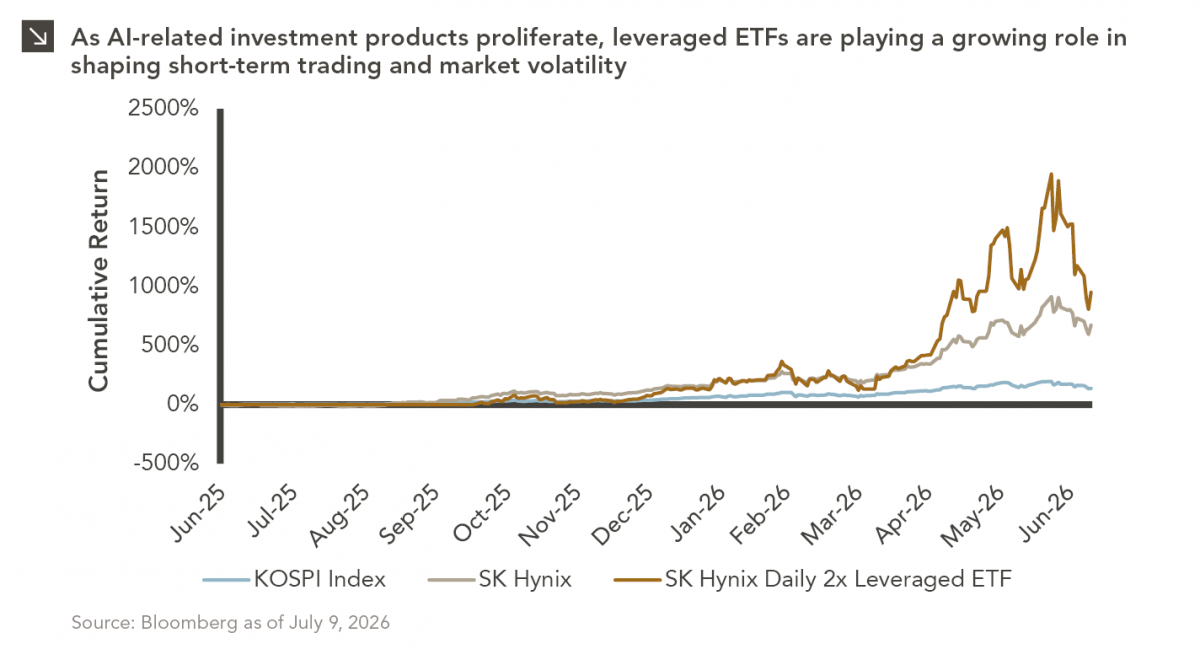
Our most recent Chart of the Week publication discussed how the AI investment opportunity has expanded beyond…
07.13.2026
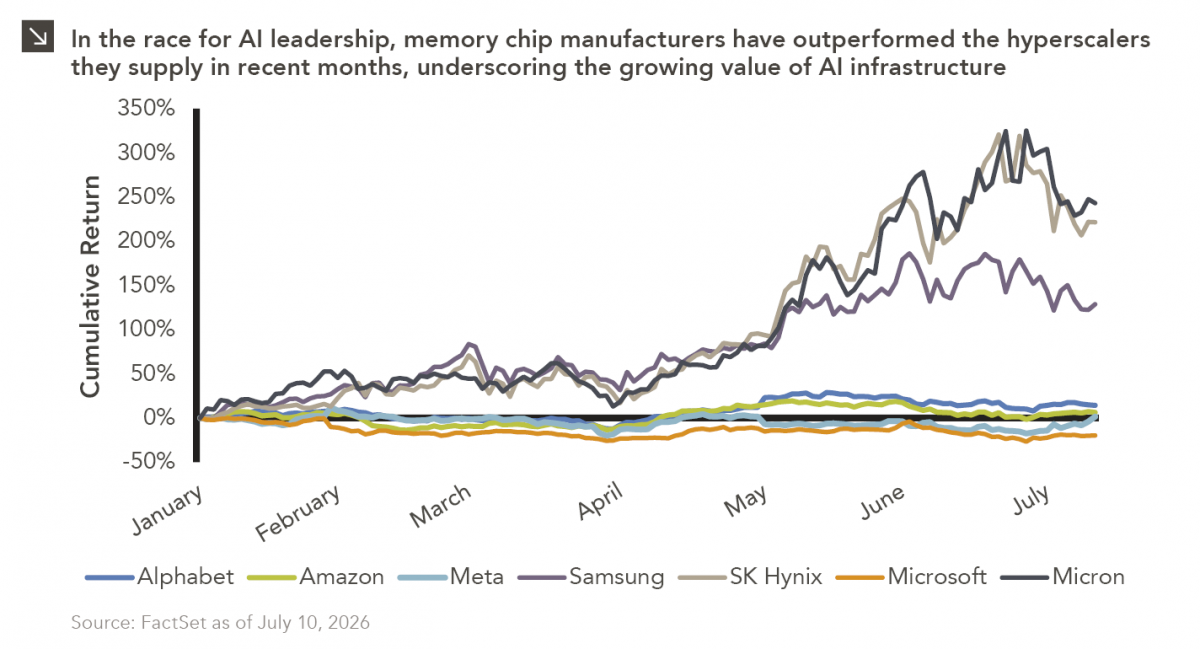
One of the enduring lessons of the California Gold Rush is that the greatest fortunes were often made not by…
07.06.2026
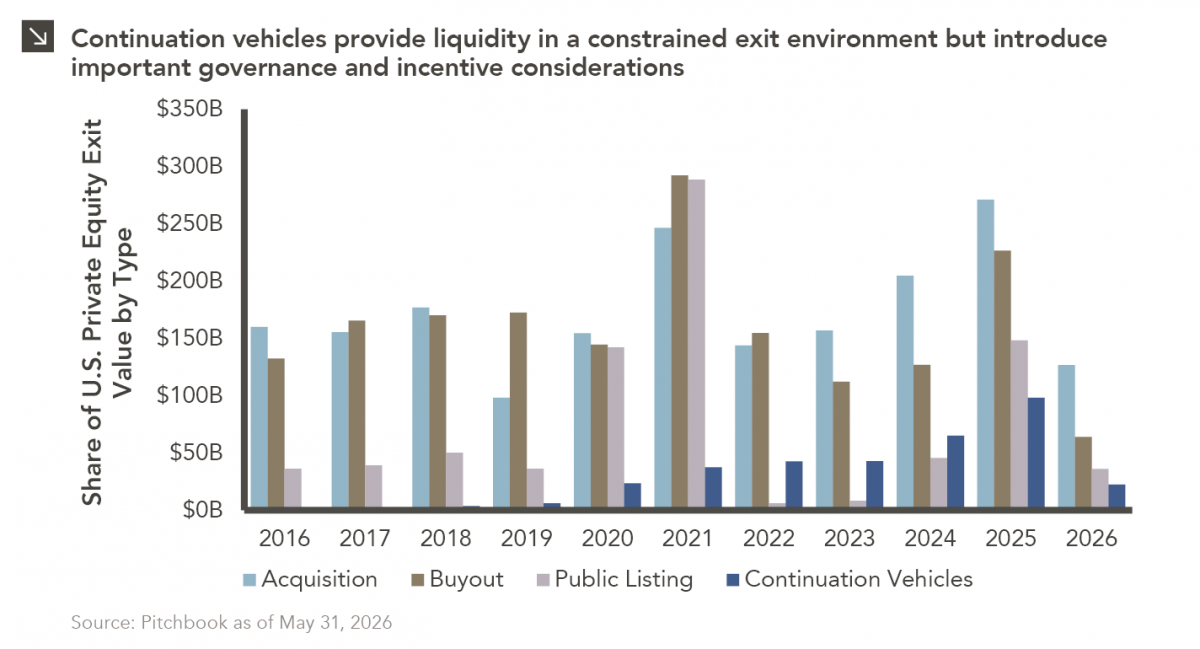
Since traditional exit routes have remained constrained in recent years due to higher interest rates, valuation gaps, and a subdued…
06.29.2026
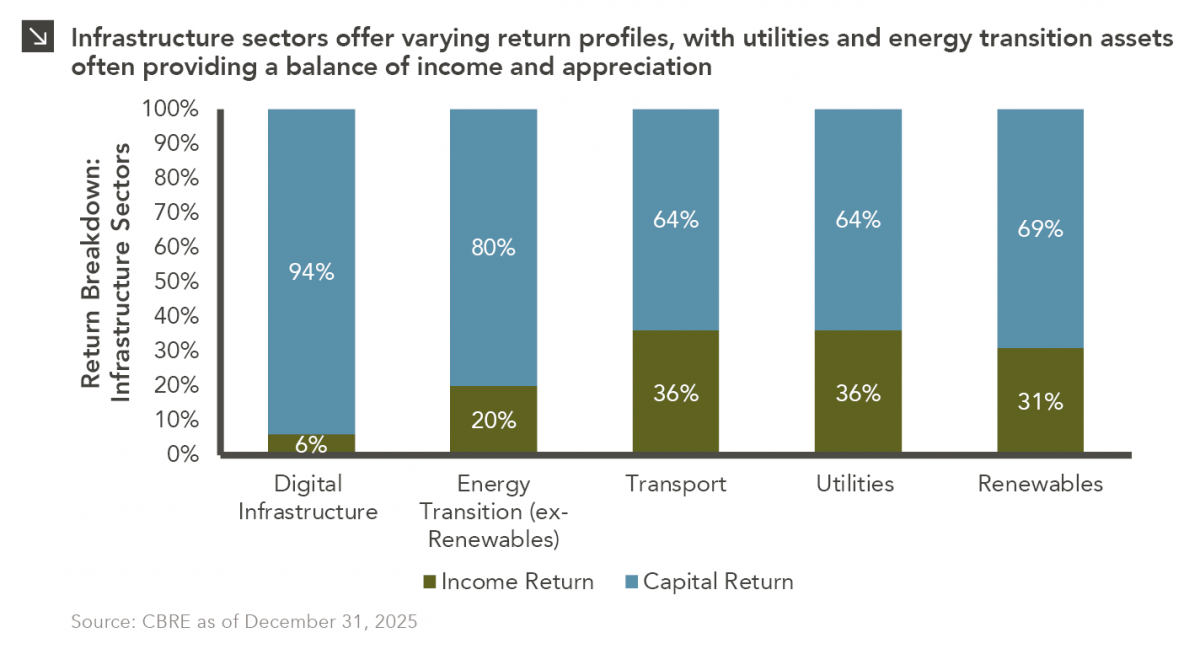
This week’s chart highlights the varying return profiles across key infrastructure sectors by illustrating the split between income and capital…
Research alerts keep you updated on our latest research publications. Simply enter your contact information, choose the research alerts you would like to receive and click Subscribe. Alerts will be sent as research is published.
We respect your privacy. We will never share or sell your information.
If you have questions or need further information, please contact us directly and we will respond to your inquiry within 24 hours.
Contact Us >