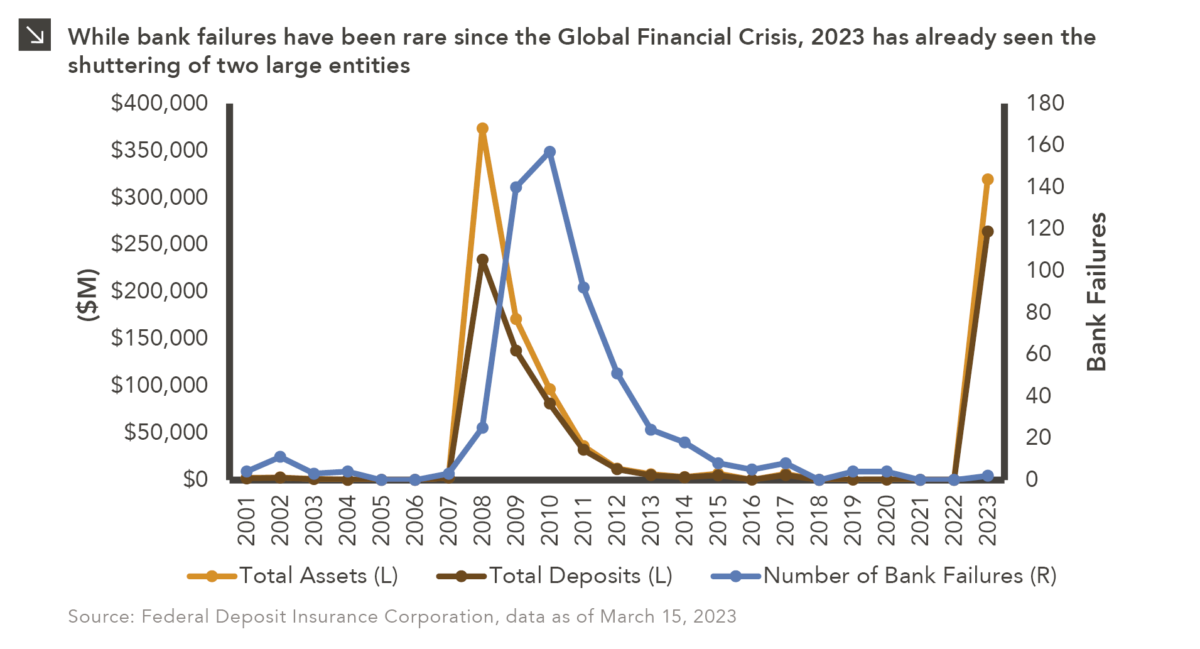
Hike! The Herald Fed Sings

The trajectory of rate hikes by the Federal Reserve has had a meaningful impact on asset values this year. Historically, rising interest rates have aligned with higher risk-adjusted returns for real estate investors, with an average 12.8% annual total return of the NPI during past periods of Fed hikes. Although higher borrowing rates increase the cost of capital for property buyers, rate hikes typically coincide with a strong economy and easy credit. Economic strength can lead to mark-to-market rent growth opportunities and strong tenant demand within in-favor sectors, and open credit markets may allow investors to increase their purchasing power, thereby expanding the pool of real estate buyers.

This year, the Fed has raised rates to specifically target heightened inflation. During periods of price pressure and subsequently higher rates, property owners tend to increase rents in order to keep pace with growing maintenance and replacement costs. Owners and investors also benefit from supply-demand dislocations when construction, financing, and labor costs rise, placing downward pressure on new supply and ultimately increasing demand for rentals. Historically, rent growth in the U.S. has averaged 3.0% in a rising Fed policy environment, compared to 1.7% and 1.4% in steady and declining rate environments, respectively.¹ While the ultimate impact to real estate valuations from this period of higher inflation, rates, and economic uncertainty is still unknown, the asset class does benefit from its ability to effectively pass through costs, providing a hedge against macro headwinds.

Print PDF > Hike! The Herald Fed Sings

¹Federal Reserve, Hines Research 1990–2021Q4 for U.S. markets, CoStar, Property Market Analysis, Colliers

Fixed Income Indexing: A Commitment to the Bottom

The equities market has experienced a tectonic shift from active to passive investing, with passive investors benefiting from index strength and meaningful fee savings. In fixed income, however, investing in indexing strategies tends to be a commitment to the bottom. The Bloomberg Aggregate Index — the standard index for broad fixed income investing — tends to underperform most active strategies. While there may be shorter time periods where active managers trail the index, over longer time periods the index generally falls within the bottom quartile of universe performance and often in the bottom decile.

Due to the size of and inefficiencies within the fixed income market, there should be many opportunities for managers to take active risks and generate excess returns. Two common active management strategies for aggregate mandates are core and core plus, differentiated by the level of active risk and return objectives. Core strategies should be expected to outperform the index by 50–100 bps and core plus by 100–150 bps over a full market cycle. The vast majority of active managers outperform the index. In the core plus universe, the index’s rolling 5-year return was in the bottom quartile 14 of the last 20 years and in the bottom decile in 10 of those years. In the core universe, where the level of active return is lower, the index on a rolling 5-year basis was in the bottom quartile in 11 of 20 years.

To be fair, there are times when indexing pays. Many fixed income managers are “active” by systematically overweighting corporate and structured credit while underweighting Treasuries and agency mortgages to create a yield advantage. Outyielding the benchmark works well until it doesn’t. During risk-off periods of spread widening, the index tends to be one of the better performers within the universe. The two best examples of this are 2002 and 2008, when markets experienced a precipitance of spread widening due to the dot com bubble bursting and the sub-prime mortgage crisis, respectively. Those periods erased years of prior active management outperformance, though having a yield advantage remained beneficial longer-term, with those active managers outperforming in subsequent years.

While active is often the preferred method of accessing the fixed income market, an aggregate indexed strategy may be helpful as a risk management tool and indexed options may help investors take more tactical positions within fixed income sub-asset classes. Overall, investors should make sure they understand the risks and benefits of investing in active versus passive within fixed income and work with their consultant to create a portfolio that best serves their needs.

Print PDF > Fixed Income Indexing: A Commitment to the Bottom


The opinions expressed herein are those of Marquette Associates, Inc. (“Marquette”), and are subject to change without notice. This material is not financial advice or an offer to purchase or sell any product. Marquette reserves the right to modify its current investment strategies and techniques based on changing market dynamics or client needs.


Rising Stars are a Bright Spot in 2022

While 2022 has been an exceptionally challenging year, with both equities and fixed income down meaningfully, there are a few bright spots within the high yield space. The number of rising stars, which are below investment grade securities (high yield) that have been upgraded to an investment grade rating, has already hit 2021 levels with two months remaining in the year. Fallen angel securities — previously investment grade businesses that have fallen to high yield or “junk bond” status — remain relatively low. The increase in rising stars over the last two years comes after a big increase in fallen angels in 2020, and has been driven in part by a recovery in economic activity following the pandemic and better financial discipline of management teams. Many companies used the period of incredibly low interest rates to shore up balance sheets and push out debt maturities. A company’s credit rating changing from high yield to investment grade is significant, especially when facing a slowdown, as it allows the company to better access funding in the capital markets. The number of rising stars is a good trend in credit and quality overall in high yield has improved. Paired with the most attractive yields in years, the forward outlook looks promising in credit.

Print PDF > Rising Stars are a Bright Spot in 2022


The opinions expressed herein are those of Marquette Associates, Inc. (“Marquette”), and are subject to change without notice. This material is not financial advice or an offer to purchase or sell any product. Marquette reserves the right to modify its current investment strategies and techniques based on changing market dynamics or client needs.

Keeping the Lights On

While overall fundamentals for U.S. equity benchmarks have remained mostly resilient this year amid a painful repricing of risk assets, earnings growth has actually been concentrated in just a few areas of the market. The blended year-over-year earnings growth rate for the S&P 500 index during the third quarter of 2022 is 2.2% (with roughly half of companies reporting at the time of this writing), though only four sectors of the index have reported growth in earnings for the period. The Energy space stands out especially among these sectors, with its earnings up a massive 134% year-over-year amid strong demand for natural resources and continued commodity price inflation. Were the sector to be excluded from the S&P 500 index, earnings for the benchmark would be down 5.1% on a year-over-year basis, despite the fact that Energy accounts for less than 6.0% of the index. This trend is expected to continue into the fourth quarter, during which total earnings growth for the index is expected to be roughly 0.5%, with a decline of 3.5% excluding the Energy sector. For the full calendar year, S&P 500 index earnings are expected to grow 6.1% and decline 0.6% without Energy stocks.

Examining data below the index level is always important when assessing the health of equity markets and company fundamentals. To that point, simply looking at earnings figures for the S&P 500 index in aggregate obscures the fact that growth-oriented spaces of the benchmark like Communication Services and Information Technology, which are expected to post year-over-year earnings declines of 22.2% and 2.1% in the third quarter, respectively, are experiencing significant headwinds amid ongoing interest rate and inflationary pressures. These trends, however, are expected to reverse beginning in the second quarter of next year when, against tough compares, the Energy space is projected to become a detractor to overall earnings growth for the S&P 500 index while the rest of the benchmark grows earnings at a positive rate. With all of this in mind, investors should continue to employ a prudent approach to diversification across asset classes, geographies, and economic sectors, which will help position portfolios for success as market leadership rotates.

Print PDF > Keeping the Lights On


The opinions expressed herein are those of Marquette Associates, Inc. (“Marquette”), and are subject to change without notice. This material is not financial advice or an offer to purchase or sell any product. Marquette reserves the right to modify its current investment strategies and techniques based on changing market dynamics or client needs.

Chinese Equities Down 17% in October

2022 has been a difficult year for Chinese equities, which are now down 43% year-to-date through October. In comparison, the MSCI Emerging Markets (EM) ex China Index is down 23% over the same period, while the MSCI World Index, a developed markets benchmark, is down 20%. It has been a seesaw year so far as Chinese equities underperformed in the first quarter, down 14% while the EM ex China index lost 3%. In the second quarter, China was one of the few countries to generate a positive return (+3%) as the EM ex China benchmark declined 18%. In the third quarter, the China index was down sharply again – -22% – with the sell-off carrying into October as other markets globally rebounded. China was down 17% in October – the worst month for the country benchmark in 11 years.

Over the course of the year there have been three key challenges to Chinese equities: 1) continuation of the zero-COVID policy, 2) property sector troubles, and 3) geopolitical issues. For most of the year, markets have reacted to various news and events centered on these three topics. More recently, markets turned sharply negative following the country’s Party Congress where President Xi Jinping was elected to an unprecedented third term and further consolidated power within the newly elected governing body. While there were hopes that the focus would shift to the economy following the Party Congress, President Xi went on to reaffirm China’s zero-COVID policy, casting a shadow over future economic growth. Chinese equities fell 8% the day after the Party Congress concluded, ending the month down 17%. Trailing and forward price-to-earnings multiples now sit close to twenty-year lows. From here, markets are likely to remain choppy, presenting both risks and opportunities to investors, until there is additional clarity regarding China’s zero-COVID policy and property sector, as well as broader geopolitical issues and China’s intentions.

Print PDF > Chinese Equities Down 17% in October


The opinions expressed herein are those of Marquette Associates, Inc. (“Marquette”), and are subject to change without notice. This material is not financial advice or an offer to purchase or sell any product. Marquette reserves the right to modify its current investment strategies and techniques based on changing market dynamics or client needs.

When Not to Quit

One of the oft-touted advantages of investing in private equity is the opportunity to buy in at a discount to public markets. This valuation discount, as measured by EV/EBITDA multiples, has persisted since 2012, widening to nearly 60% in 2020.¹ Since that peak, the discount has narrowed significantly as public market equities have sold off. While this may give some cause to pause, it is interesting to consider what transpired for investors between 2009 and 2012, on the heels of a near-meltdown of the financial system. With equities down sharply into 2009, the denominator effect boosted percentage allocations to private equity within investor portfolios. The instinctive reaction (and in some cases, forced action) may have been to abstain from new private equity investments beginning in 2009 so as not to exacerbate the over-allocation. This may sound familiar to private equity investors in 2022.

With hindsight being 20/20, these corrections to annual capital commitments ultimately resulted in an under-allocation to private equity, and thus underperforming portfolios over the next decade, as public markets and public market allocations snapped back. Furthermore, while private equity will likely not see the type of drawdown that public markets have seen, we do expect valuations to pull back, creating attractive entry points for managers with dry powder to deploy capital. While investors should be mindful of any liquidity constraints and maximum allocations to private markets, those that are able to remain steadfast in their annual commitment pacing schedules may find themselves in a better position once the public markets settle. Marquette believes that a successful private equity program is one that is consistently diversified by vintage year over time and highly selective in terms of manager partnerships.

Print PDF > When Not to Quit

¹Pitchbook, as of June 30, 2022


The opinions expressed herein are those of Marquette Associates, Inc. (“Marquette”), and are subject to change without notice. This material is not financial advice or an offer to purchase or sell any product. Marquette reserves the right to modify its current investment strategies and techniques based on changing market dynamics or client needs.

The Forgotten Man

While there has been no shortage of recent headlines dissecting the sorry state of the economy and markets, the average U.S. consumer is occasionally overlooked in that narrative. Year-to-date, the Federal Reserve has increased the federal funds rate by 300bps. As the Fed raises rates, the prime rate, or rate set by commercial banks, increases in tandem. For the average Joe, this means any interest rates that are not fixed increase as well, including credit card rates and adjustable mortgage rates. Consumers in the market for a home or vehicle also face higher fixed rates on new loans. This year, rates have reached highs not seen in years: mortgage rates — currently at 6.9% for a 30-year fixed loan — have not been this high since 2002, auto rates at 5.5% are the highest in more than 10 years, and credit card rates — at 16.3% — have never been this high in a data series dating back to 1994.

In an environment where the average consumer is already paying higher prices for fuel, food, and other staples due to soaring inflation, increasing credit card and auto loan rates add to the burden. While consumer spending has so far been fairly resilient to rising prices, the underlying dynamics are not sustainable. According to a Forbes survey from June 2022,¹ 67% of Americans have dipped into their savings for spending, with 31% either depleting their savings or using a significant portion of it. With all eyes on U.S. GDP, it is important to remember that consumer spending makes up 70% of the economy, and the health of the average Joe is what will determine our path from here.

Print PDF > The Forgotten Man

¹Forbes Advisor OnePoll survey, June 2022


The opinions expressed herein are those of Marquette Associates, Inc. (“Marquette”), and are subject to change without notice. This material is not financial advice or an offer to purchase or sell any product. Marquette reserves the right to modify its current investment strategies and techniques based on changing market dynamics or client needs.

Fighting Fire with Oil

Lower oil prices, primarily via lower gasoline prices, were a key contributor to headline CPI moving off peak in July and August. Since late September, however, oil and gasoline prices have started to rise again. In early October, OPEC+ — comprised of the 13 OPEC members and 10 additional major oil-exporting countries, including Russia — agreed to steep oil production cuts, decreasing supply in an already stressed market. The total production cut is estimated to be around 2 million barrels per day (bpd), approximately 2% of global supply and the biggest production cut since the start of the COVID pandemic.

The move is expected to prop oil prices back up — as similar production cuts have done historically — after the commodity had fallen considerably over the last three months amid fears of a global recession, the stronger dollar, and higher interest rates. Higher energy prices would weigh on European countries, which are more heavily reliant on Russian oil and already facing recession, as well as the U.S. consumer, with oil accounting for roughly half of the retail price of gasoline. Earlier this year Federal Reserve Chair Jerome Powell quantified the impact of higher oil prices, noting every $10 per barrel increase in the price of crude raises inflation by 0.2% and sets back economic growth by 0.1%. The decision also adds to already heightened geopolitical tensions, with President Biden pursuing consequences for Saudi Arabia, the de facto leader of OPEC, following the announcement. This evolving situation is one more unknown variable to monitor as we look for macroeconomic clarity.

Print PDF > Fighting Fire With Oil


The opinions expressed herein are those of Marquette Associates, Inc. (“Marquette”), and are subject to change without notice. This material is not financial advice or an offer to purchase or sell any product. Marquette reserves the right to modify its current investment strategies and techniques based on changing market dynamics or client needs.

Picking up the Pieces: Assessing the Economic Impact of Hurricane Ian

The 2022 hurricane season is the latest headwind in a challenging year for investors. Last week, Hurricane Ian made landfall in Florida as a powerful Category 4 hurricane, unleashing heavy rains, high sustained winds, and extensive flooding along the coast. While the full extent of damages and the ultimate impact on the U.S. economy will not be known for several months, preliminary estimates indicate that Hurricane Ian will rank among the top 10 costliest storms in U.S. history. Current estimates of Hurricane Ian’s total cost — including damages and lost economic activity — range widely from $65 billion to as much as $120 billion. While several industries across the southeastern United States have been negatively impacted, Hurricane Ian’s overall impact on U.S. GDP is expected to be limited. Recent analysis by EY Parthenon, Ernst and Young’s global consulting arm, projects GDP to be reduced by 30 basis points in Q3 and 10 basis points in Q4 as a result of the hurricane. Natural disasters tend to have short-term economic consequences, with lost economic output recovered over time as federal assistance and insurance payouts allow communities to rebuild. Reconstruction efforts can also provide a temporary boost to GDP. As with other sources of uncertainty, Marquette encourages investors to maintain discipline and stick to long-term strategic allocations to best weather the market’s storms.

Print PDF> Picking up the Pieces: Assessing the Economic Impact of Hurricane Ian

The opinions expressed herein are those of Marquette Associates, Inc. (“Marquette”), and are subject to change without notice. This material is not financial advice or an offer to purchase or sell any product. Marquette reserves the right to modify its current investment strategies and techniques based on changing market dynamics or client needs.

Inflation: Expectations Matter

The announcement of another 75 basis point rate hike at last week’s FOMC meeting reaffirmed the Federal Reserve’s unwavering commitment to reducing inflation. One of the key variables the Fed watches to help it determine the path of rates is expected inflation. Inflation can become a self-fulfilling prophecy if consumers start pricing future inflation into their decision-making and businesses start making anticipatory adjustments to their prices and behavior. To combat this, the Fed strives to anchor expectations around a 2% target inflation rate. When long-term inflation forecasts deviate from that 2% target it means inflation expectations are not well-anchored, i.e., people believe that a short-term rise in inflation could lead to higher price levels longer-term.

Inflation expectations have moved further away from the 2% target over the course of 2022, something the Fed recognizes as a potential roadblock in navigating the current inflationary environment. Indeed, Fed Chair Jerome Powell stressed the importance of “expeditiously continuing to raise rates” to “ensure that longer-term inflation expectations remain well-anchored” at the June FOMC press conference.¹ With higher-than-anticipated August CPI figures, however — headline inflation of 8.3% and core inflation that reaccelerated to 6.3% — inflation expectations may remain higher for longer. Headline inflation is moving in the right direction, but core inflation, which remains well above Fed targets, tends to be stickier and may further complicate the Fed’s task. While there are no crystal balls, longer-term inflation expectations will continue to bear monitoring as investors search for potential indicators of a market bottom.

Print PDF > Inflation: Expectations Matter

¹ Lee, J., Powell, T., & Wessel, D. (2022, June 27). What are inflation expectations? Why do they matter? The Brookings Institute. Retrieved September 28, 2022.


The opinions expressed herein are those of Marquette Associates, Inc. (“Marquette”), and are subject to change without notice. This material is not financial advice or an offer to purchase or sell any product. Marquette reserves the right to modify its current investment strategies and techniques based on changing market dynamics or client needs.