Concentrating on Market Concentration

January 20, 2026 | Weston Whalen, CFA, Associate Research Analyst

Two charts comparing (left) weight of top 10 constituents and (right) contribution to 2025 return of the MSCI United States Index, MSCI Emerging Markets Index, and MSCI EAFE Index.

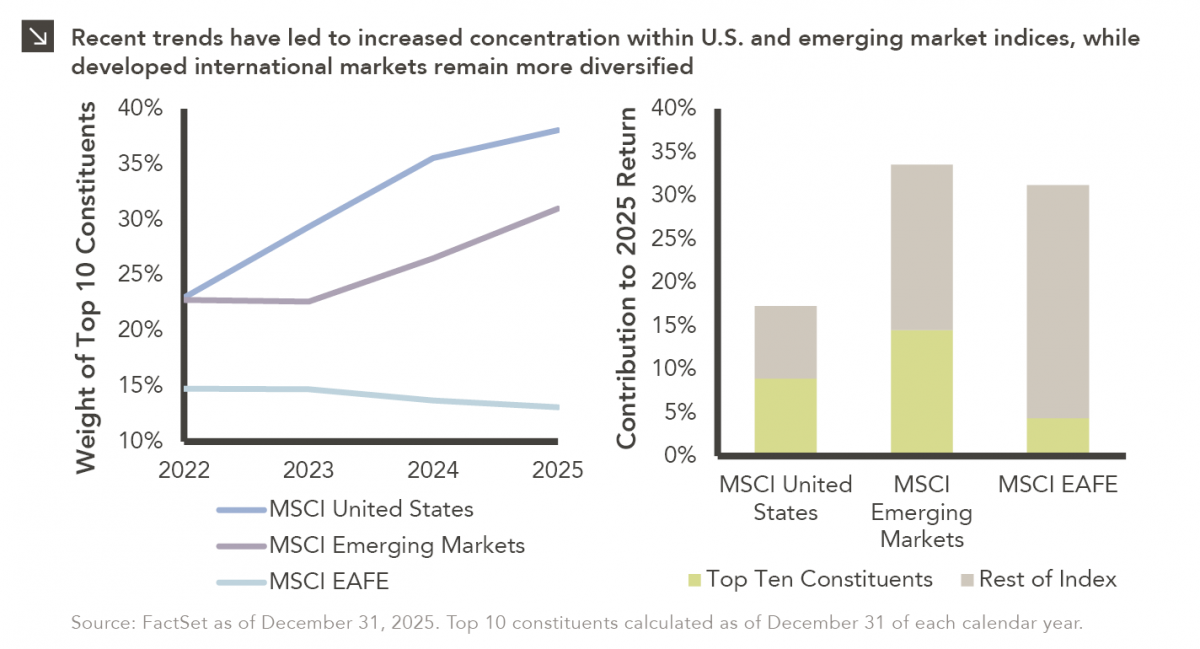
Last week, Alphabet joined NVIDIA, Microsoft and Apple as the only companies to ever reach a market capitalization of $4 trillion. The growth of these and other U.S. mega-cap technology companies has completely changed the composition of indices that measure the domestic equity market. Indeed, the weight of the top 10 constituents of the MSCI United States Index (which is comprised of large- and mid-cap stocks) sat at roughly 23% just three years ago. At the end of last year, however, that figure sat closer to 38%. As can be seen above, this concentration has resulted in a handful of stocks driving a significant share of overall index returns in recent periods. Interestingly, the theme of market concentration is not exclusive to domestic indices. For instance, companies in China, Taiwan, and South Korea have helped provide the materials required for the artificial intelligence boom, and the growth of these businesses has led to higher levels of concentration for the MSCI Emerging Markets index. The top 10 constituents now represent slightly less than one-third of this index, and TSMC, the largest producer of semiconductors in the world, notably comprises roughly 12% of the benchmark. Similar to trends within domestic markets, these top constituents had an outsized impact on the return of the MSCI Emerging Markets Index in 2025.

Interestingly, the MSCI EAFE Index, which is comprised of non-U.S. developed markets large- and mid-cap stocks, has not followed these same trends, with the weight of its top 10 constituents actually decreasing in recent years. While its largest holding is ASML, a supplier for the semiconductor industry, this benchmark is not nearly as heavily tilted towards the AI boom as domestic and emerging markets indices. For this reason, developed international markets could be a stronger source of diversification for investors moving forward.

Print PDF

Weston Whalen, CFA
Associate Research Analyst

Get to Know Weston

The opinions expressed herein are those of Marquette Associates, Inc. (“Marquette”), and are subject to change without notice. This material is not financial advice or an offer to purchase or sell any product. Marquette reserves the right to modify its current investment strategies and techniques based on changing market dynamics or client needs.

Related Content

Four-line chart showing weight in Bloomberg Aggregate U.S. Bond Index for Treasuries, Government-Related, Corporate, and Securitized sub-indices, 12/31/1999 through 3/31/2026. For date range shown, Treasuries started at 31.7% and end at 45.9%. Government-Related start at 11.4% and end at 4.3%. Corporates start at 20.9% and end at 23.9%. Securitized start at 36.0% and end at 25.9%. For full dataset, please contact marquettemarketing@marquetteassociates.com.

05.18.2026

The “Magnificent One”

Over the last few years, equity markets have been defined by a group of stocks often referred to as the…

Combination column and line chart showing increase in non-renewables and renewables in net installed capacity (GW) in columns and share of new electricity generating capacity by renewables (line) annually since 2005. Renewables ave seen a marked increase in recent years (183.95GW in 2019 to 691.94GW in 2025). Renewable Share was at 86% for 2025. For full dataset, please contact marquettemarketing@marquetteassociates.com.

05.11.2026

A Renewed Focus on Renewables

In addition to the humanitarian toll of the conflict in Iran, the world is currently confronting the impact that trade…

Stacked column chart showing Weight in S&P 500 Index in 1985, 1995, 2005, 2015, and 2025 for top 10 companies at that time, with companies stacked for each year by weight. From 1985-2015, top 10 weight ranged from 17.6% to 21.1%, but 2025's weight was 40.6%. Company makeup changes over time, with no companies from 1985/1995 categories in 2025. For full dataset, please contact marquettemarketing@marquetteassociates.com.

05.04.2026

This Too Shall Reconstitute

Rooted in medieval Persian Sufi thought, the adage “this too shall pass” speaks to the fleeting and impermanent nature of…

Three-line chart comparing cumulative returns for MSCI EM Latin America Index, MSCI EAFE Index, and S&P 500 Index, Jan 1, 2026 through April 24, 2026. Dashed line at February 28 demarcates U.S. strikes on Iran. While all three indices dipped after war began, Latin America Index was higher to begin with and remains high. Most recent data point (4/24) for Latin America is 20.36%, EAFE is 5.7%, and S&P 500 is 5.06%. For full dataset, please email marquettemarketing@marquetteassociates.com.

04.27.2026

Let’s Hear It for Latin America

Latin American equity markets have shown remarkable strength in 2026. After a strong start to the year, the MSCI Emerging…

Two-line chart showing unemployment rate for All U.S. Workers and Recent College Graduates (Ages 22–27), 12/31/05 to 12/31/25. Up to 2020 period, Recent College Graduates generally had a lower unemployment rate than all U.S. workers category, but since then, the opposite has been true. Lines begin at ~3% to ~5% range in 2005, rose during Global Financial Crisis of '07-'09 to near 10% for All, ~7% for Grads, then both lines declined fairly steadily up to COVID. Peak for both series was 6/30/20, with All at 12.8% and Grads at 13.4%. Most recent data for 12/31/25 is ~4% for All and ~5.5% for Grads. For full dataset, please email marquettemarketing@marquetteassociates.com.

04.20.2026

The Sorrows of Young Workers

Entry-level jobs have traditionally served as the primary bridge between education and stable employment, offering young workers a foothold from…

Combination column and line chart showing Net Duties Received (columns, left-hand axis, ranging $0 to $35 billion) and Effective Tariff Rate (line, right-hand axis, ranging 0 to 12%) monthly, from April 2024 through February 2025. Up to March 2025, both data series held relatively steady, averaging around $7B for net duties received, and 2% for effective tariff rate, but both series have quadrupled since then. Most recent (Feb-26) is $26B and 8%. Please contact us for the full data set at marquettemarketing@marquetteassociates.com.

04.13.2026

Liberation Day: One Year Later

On April 2, 2025, President Donald Trump announced a sweeping set of tariffs on imports into the United States. Dubbed…

More articles

Subscribe to Research Email Alerts

Research Email Alert Subscription

Research alerts keep you updated on our latest research publications. Simply enter your contact information, choose the research alerts you would like to receive and click Subscribe. Alerts will be sent as research is published.

We respect your privacy. We will never share or sell your information.

Thank You

We appreciate your interest in Marquette Associates.

If you have questions or need further information, please contact us directly and we will respond to your inquiry within 24 hours.

Contact Us >