02.09.2026
Precious Metals Lose Their Luster… Perhaps
Precious metals have been going on a magnificent run in recent years. Specifically, gold moved from $1,898/ounce at the end…

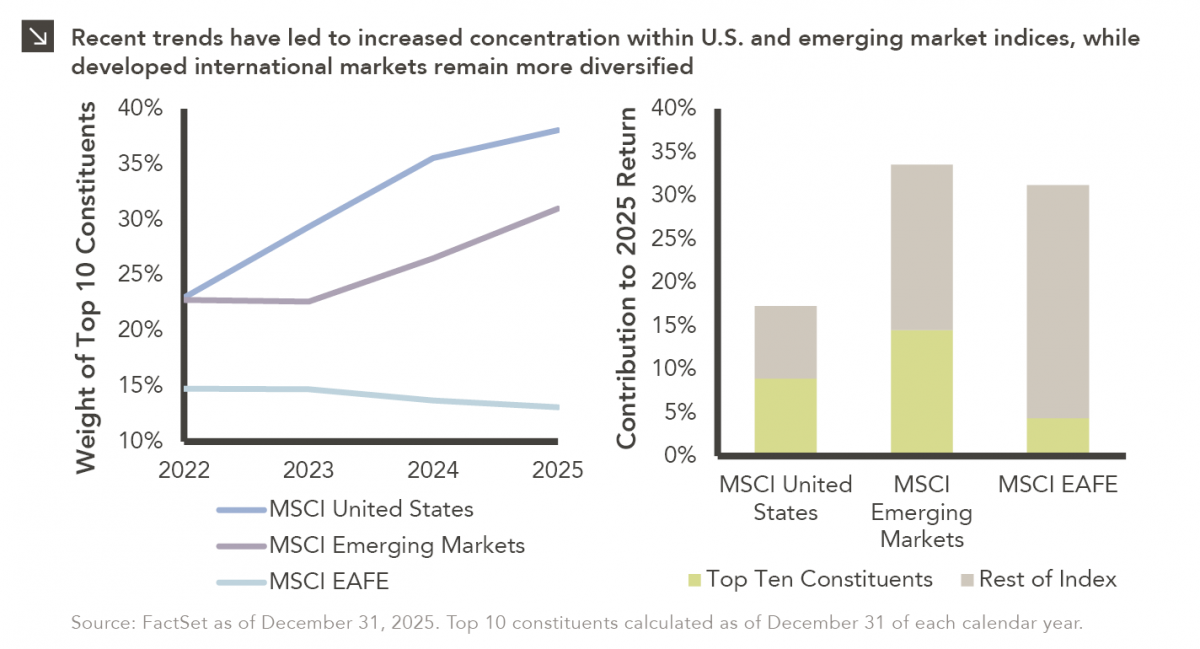
Equity performance in China, with the MSCI China Index down 5.5% through the first half of the year, has disappointed amid hopes for a strong post-COVID recovery. While macro data started the year strong, momentum quickly waned, with a cautious consumer and a slowdown in manufacturing. China’s property sector troubles have continued, and U.S./China tensions remain, with the U.S. moving toward stricter regulation and reduced investment in the Chinese technology sector in 2024. Along with human rights concerns and the general unpredictability of the Chinese government, the debate around China’s investability continues on.
Take China out of the emerging markets picture, however, and the story is different. The MSCI Emerging Markets Index excluding China — the largest single country weight in the index at nearly 30%¹ — has outperformed the broader benchmark since late 2021. Latin American countries like Brazil and Mexico — almost 6% and 3% weights in the index, respectively — have benefited from central banks that began their monetary policy tightening cycle earlier. Additionally, as renewable energy trends continue, Latin American regions rich in natural resources should see exports grow. Nearshoring trends have also benefitted emerging market countries such as Taiwan — the second largest country weight in the index at nearly 16% — and Mexico, with the latter exporting nearly as much to the U.S. as China, something not seen since 2003. And in India — the third largest country weighting in the MSCI EM Index at approximately 15% — government reform programs have drawn in significant investor flows.
Looking into the second half of the year, the evolving macro picture in China, including any potential stimulus, will continue to be a driving factor of overall MSCI EM performance. And outside of China, there are a number of interesting trends playing out across the emerging markets space that should present investment opportunities for active managers.
The opinions expressed herein are those of Marquette Associates, Inc. (“Marquette”), and are subject to change without notice. This material is not financial advice or an offer to purchase or sell any product. Marquette reserves the right to modify its current investment strategies and techniques based on changing market dynamics or client needs.

02.09.2026
Precious metals have been going on a magnificent run in recent years. Specifically, gold moved from $1,898/ounce at the end…
02.02.2026
Macroeconomic forecasting is challenging in the best of times and proved downright impossible in 2025, which saw high levels of…
01.26.2026
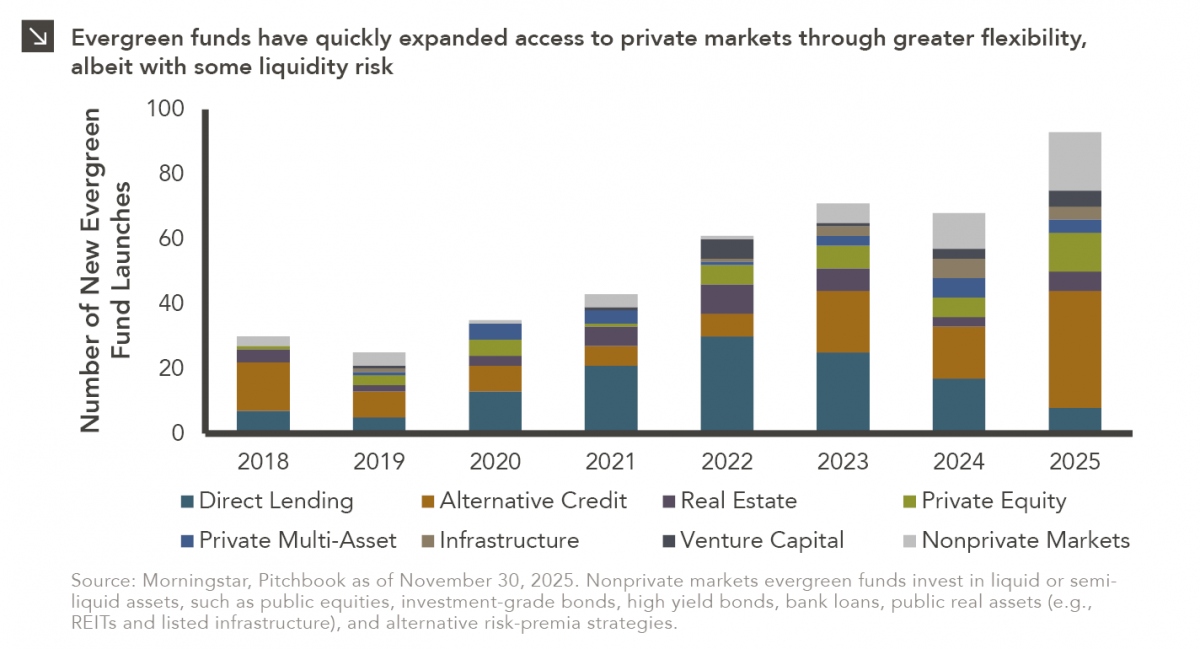
In recent years, access to traditionally illiquid private markets has expanded through the rapid growth of evergreen funds, which provide…
01.22.2026
Anyone who has gone snowmobiling knows it can be simultaneously exhilarating and terrifying. Throttling across snow and through a forest…
01.20.2026
Last week, Alphabet joined NVIDIA, Microsoft and Apple as the only companies to ever reach a market capitalization of $4…

01.07.2026
This video is a recording of a live webinar held January 15 by Marquette’s research team analyzing 2025 across the…
Research alerts keep you updated on our latest research publications. Simply enter your contact information, choose the research alerts you would like to receive and click Subscribe. Alerts will be sent as research is published.
We respect your privacy. We will never share or sell your information.
If you have questions or need further information, please contact us directly and we will respond to your inquiry within 24 hours.
Contact Us >