07.24.2026
2026 Halftime Market Insights
This video is a recording of a live webinar held July 23 by Marquette’s research team analyzing the first half…
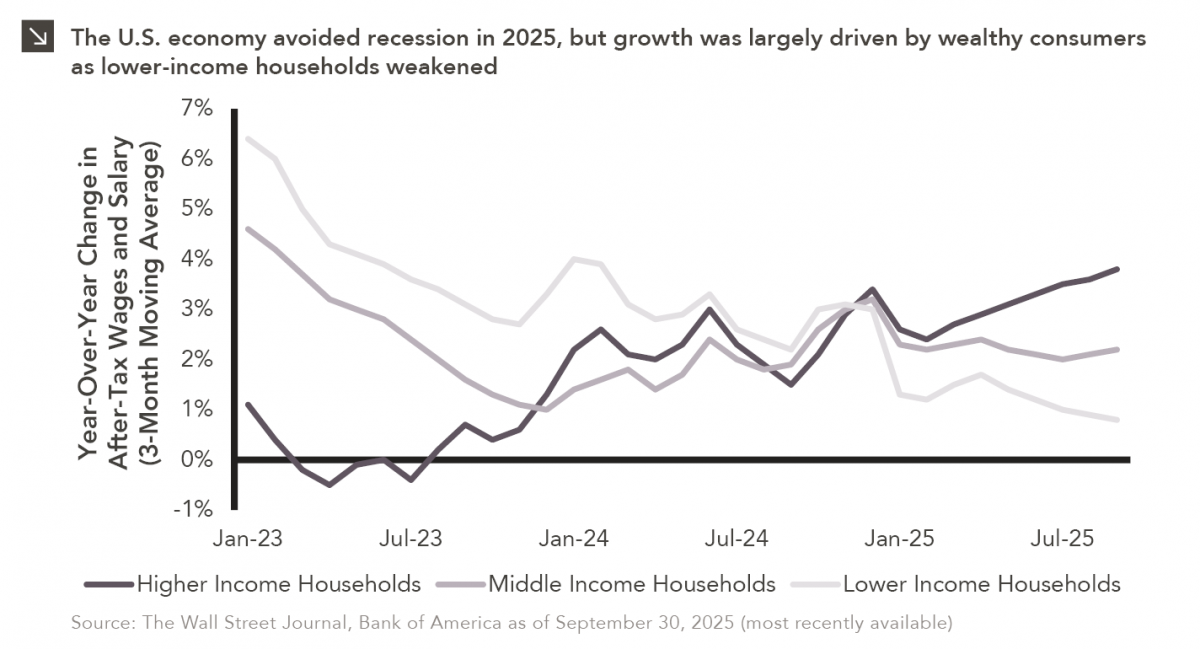
Macroeconomic forecasting is challenging in the best of times and proved downright impossible in 2025, which saw high levels of geopolitical instability and policy uncertainty. Many economists were cautiously optimistic about the state of the global economy at the start of last year, only to revise growth forecasts sharply downward after President Trump’s tariff announcements in April. By summer, markets and economists alike were still largely convinced that a recession was imminent, but this anticipated downturn did not materialize. On the contrary, high-level GDP and consumer spending data for 2025 suggest stable (albeit slowing) economic growth. Despite steady headline figures, however, concerns remain surrounding potential softening of the domestic labor market and slowing real-wage growth. As illustrated by the chart above, these effects are distributed unevenly across income brackets, with wages rising by 3.8% for the highest-earning households over the last year, compared to only 0.8% for lower-earning households. Consumption for lower-income households has also declined in recent time, with a Moody’s survey estimating that the top 10% wealthiest U.S. households now account for roughly half of all consumer spending. Equity market performance has exacerbated this inequality, as wealthier individuals tend to have a larger percentage of their net worth invested in financial assets.
Economic bifurcation, often referred to as a “K-shaped economy,” explains why strong GDP growth can occur in tandem with deteriorating consumer confidence. This dynamic has also challenged policymakers, as institutions like the Federal Reserve have been tasked in recent years with both cooling inflation and preventing further labor market deterioration. Moreover, as lower-income households struggle to finance essential purchases, it is possible that future GDP growth will be contingent on wealthier households spending at current or higher rates. It follows that an event that leads to a pullback in spending (e.g., an equity market downturn) could be detrimental to overall growth. While predicting the trajectory of the economy is certainly a challenge, understanding these dynamics offers some insight into the indicators to monitor in 2026.
Print PDFThe opinions expressed herein are those of Marquette Associates, Inc. (“Marquette”), and are subject to change without notice. This material is not financial advice or an offer to purchase or sell any product. Marquette reserves the right to modify its current investment strategies and techniques based on changing market dynamics or client needs.

07.24.2026
This video is a recording of a live webinar held July 23 by Marquette’s research team analyzing the first half…
07.22.2026
The usual midyear version of these letters has touched on year-to-date performance as well as the most influential macroeconomic and…

07.20.2026
Our most recent Chart of the Week publication discussed how the AI investment opportunity has expanded beyond…

07.13.2026
One of the enduring lessons of the California Gold Rush is that the greatest fortunes were often made not by…

07.06.2026
Since traditional exit routes have remained constrained in recent years due to higher interest rates, valuation gaps, and a subdued…

06.29.2026
This week’s chart highlights the varying return profiles across key infrastructure sectors by illustrating the split between income and capital…
Research alerts keep you updated on our latest research publications. Simply enter your contact information, choose the research alerts you would like to receive and click Subscribe. Alerts will be sent as research is published.
We respect your privacy. We will never share or sell your information.
If you have questions or need further information, please contact us directly and we will respond to your inquiry within 24 hours.
Contact Us >