07.27.2026
Liquidity Isn’t Free
The rapid growth of non-traded business development companies (BDCs), which are investment vehicles that pool investor capital to make loans…
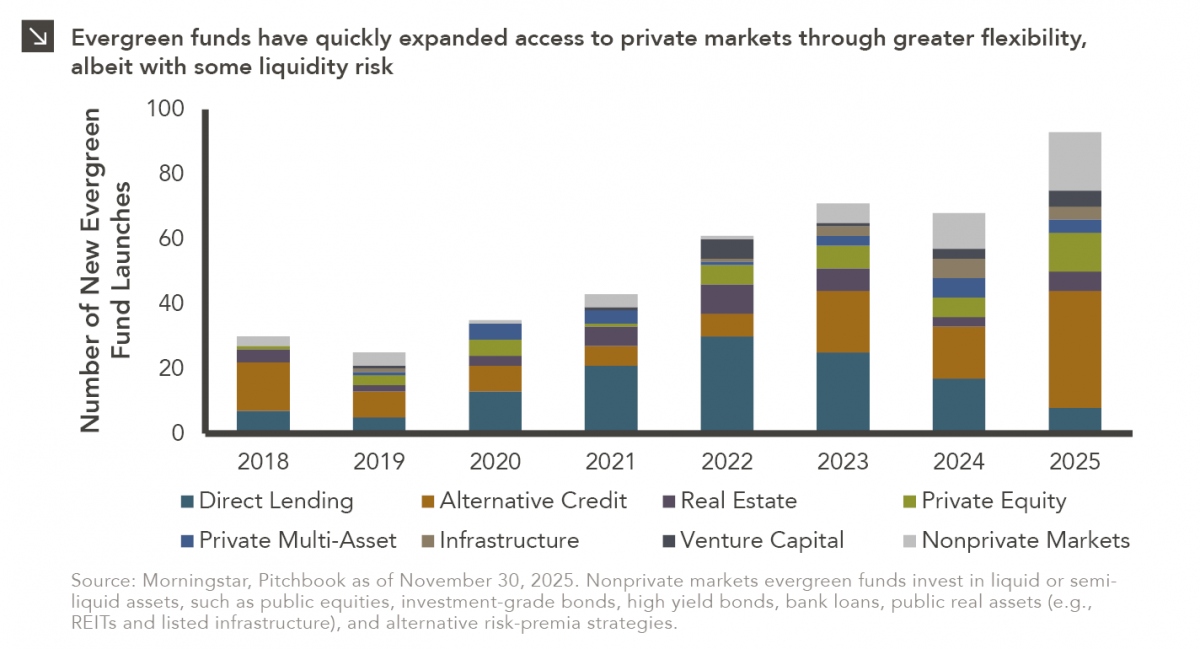
In recent years, access to traditionally illiquid private markets has expanded through the rapid growth of evergreen funds, which provide investors with more favorable subscription and liquidity terms than traditional closed-end vehicles. New evergreen fund launches notably increased from 30 in 2018 to 107 in 2025, with alternative credit strategies emerging as the primary driver of this growth (36 new fund launches last year). Many new funds have also come to market in the private equity, real estate, and infrastructure spaces, and these dynamics can be observed in the chart above. There are more than 500 active evergreen funds available to investors currently.
Broad adoption of the evergreen structure reflects growing demand for more illiquid assets across both institutional and retail investors. In addition to the advantageous terms mentioned above, many offer seasoned and diversified exposures, which can help mitigate the J-curve effect that is exhibited within private markets. Many evergreen funds also have lower investment minimums and less operational complexity relative to closed-end vehicles. All of these factors have contributed to the proliferation of evergreens detailed above. It is important to note, however, that there are drawbacks associated with evergreen fund investing, including potential liquidity mismatches and gating risk. Overall, while evergreen funds have broadened access to private markets through greater flexibility and lower barriers to entry, investors must balance these benefits against the structural liquidity and redemption risks inherent in illiquid asset classes.
Print PDFThe opinions expressed herein are those of Marquette Associates, Inc. (“Marquette”), and are subject to change without notice. This material is not financial advice or an offer to purchase or sell any product. Marquette reserves the right to modify its current investment strategies and techniques based on changing market dynamics or client needs.

07.27.2026
The rapid growth of non-traded business development companies (BDCs), which are investment vehicles that pool investor capital to make loans…

07.24.2026
This video is a recording of a live webinar held July 23 by Marquette’s research team analyzing the first half…

07.20.2026
Our most recent Chart of the Week publication discussed how the AI investment opportunity has expanded beyond…

07.13.2026
One of the enduring lessons of the California Gold Rush is that the greatest fortunes were often made not by…

07.06.2026
Since traditional exit routes have remained constrained in recent years due to higher interest rates, valuation gaps, and a subdued…

06.29.2026
This week’s chart highlights the varying return profiles across key infrastructure sectors by illustrating the split between income and capital…
Research alerts keep you updated on our latest research publications. Simply enter your contact information, choose the research alerts you would like to receive and click Subscribe. Alerts will be sent as research is published.
We respect your privacy. We will never share or sell your information.
If you have questions or need further information, please contact us directly and we will respond to your inquiry within 24 hours.
Contact Us >