Julia Sheehan
Research Analyst
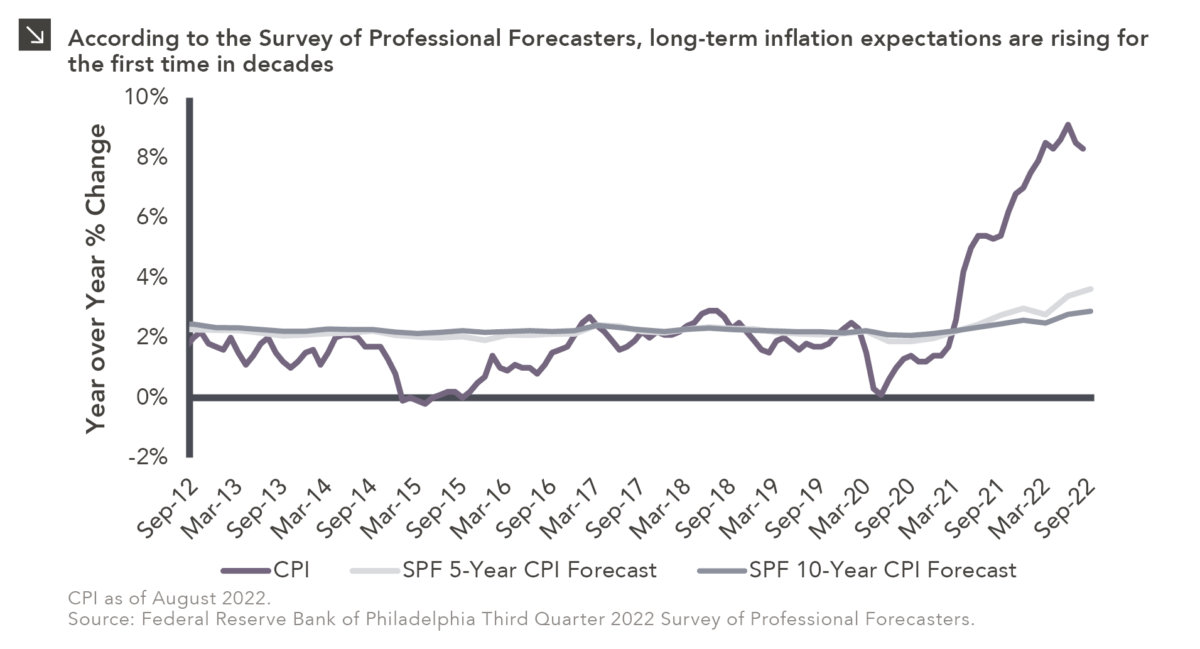
The announcement of another 75 basis point rate hike at last week’s FOMC meeting reaffirmed the Federal Reserve’s unwavering commitment to reducing inflation. One of the key variables the Fed watches to help it determine the path of rates is expected inflation. Inflation can become a self-fulfilling prophecy if consumers start pricing future inflation into their decision-making and businesses start making anticipatory adjustments to their prices and behavior. To combat this, the Fed strives to anchor expectations around a 2% target inflation rate. When long-term inflation forecasts deviate from that 2% target it means inflation expectations are not well-anchored, i.e., people believe that a short-term rise in inflation could lead to higher price levels longer-term.
Inflation expectations have moved further away from the 2% target over the course of 2022, something the Fed recognizes as a potential roadblock in navigating the current inflationary environment. Indeed, Fed Chair Jerome Powell stressed the importance of “expeditiously continuing to raise rates” to “ensure that longer-term inflation expectations remain well-anchored” at the June FOMC press conference.¹ With higher-than-anticipated August CPI figures, however — headline inflation of 8.3% and core inflation that reaccelerated to 6.3% — inflation expectations may remain higher for longer. Headline inflation is moving in the right direction, but core inflation, which remains well above Fed targets, tends to be stickier and may further complicate the Fed’s task. While there are no crystal balls, longer-term inflation expectations will continue to bear monitoring as investors search for potential indicators of a market bottom.
Print PDF > Inflation: Expectations Matter
¹ Lee, J., Powell, T., & Wessel, D. (2022, June 27). What are inflation expectations? Why do they matter? The Brookings Institute. Retrieved September 28, 2022.

The opinions expressed herein are those of Marquette Associates, Inc. (“Marquette”), and are subject to change without notice. This material is not financial advice or an offer to purchase or sell any product. Marquette reserves the right to modify its current investment strategies and techniques based on changing market dynamics or client needs.

02.09.2026
Precious metals have been going on a magnificent run in recent years. Specifically, gold moved from $1,898/ounce at the end…
02.02.2026
Macroeconomic forecasting is challenging in the best of times and proved downright impossible in 2025, which saw high levels of…
01.26.2026
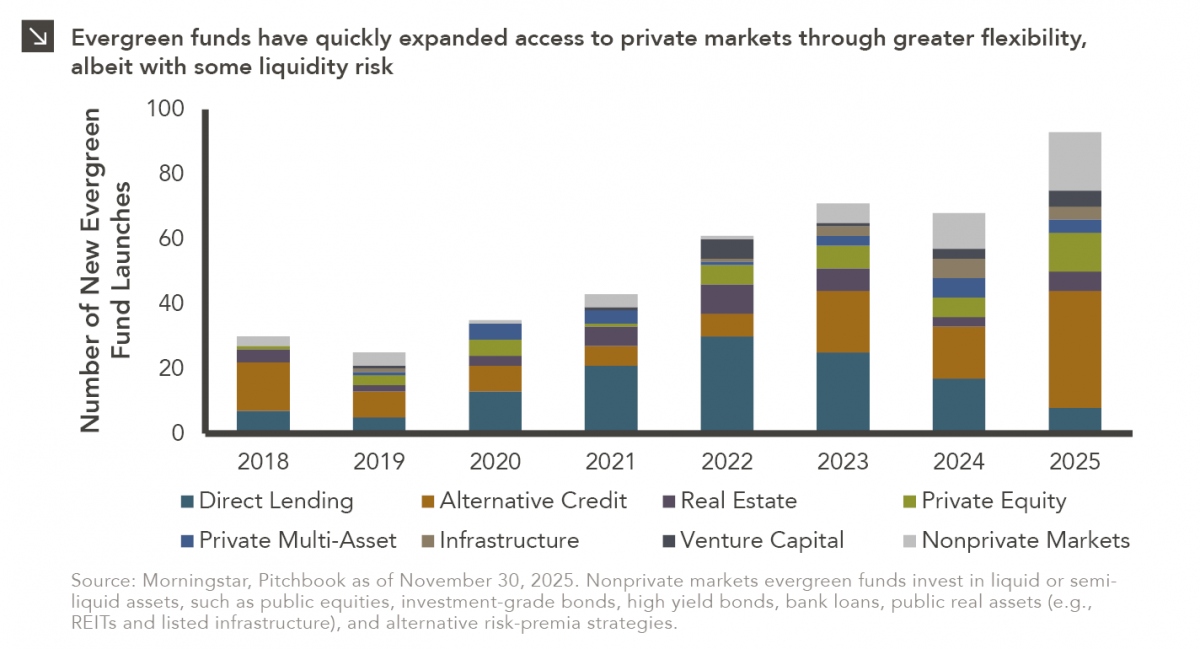
In recent years, access to traditionally illiquid private markets has expanded through the rapid growth of evergreen funds, which provide…
01.22.2026
Anyone who has gone snowmobiling knows it can be simultaneously exhilarating and terrifying. Throttling across snow and through a forest…
01.20.2026
Last week, Alphabet joined NVIDIA, Microsoft and Apple as the only companies to ever reach a market capitalization of $4…

01.07.2026
This video is a recording of a live webinar held January 15 by Marquette’s research team analyzing 2025 across the…
Research alerts keep you updated on our latest research publications. Simply enter your contact information, choose the research alerts you would like to receive and click Subscribe. Alerts will be sent as research is published.
We respect your privacy. We will never share or sell your information.
If you have questions or need further information, please contact us directly and we will respond to your inquiry within 24 hours.
Contact Us >