Mike Spychalski, CAIA
Vice President
Since the current bull market began in March 2009, the S&P 500 has posted an annualized return of 19.5%. During that time period, the trailing 12-month price to earnings ratio (P/E ratio) of the S&P 500 has increased from 14.2 to 18.1 (an increase of 27%). Over that same period, the trailing 12-month price to sales ratio (P/S ratio) has increased from 0.8 to 1.8 (an increase of 118%). The current P/E ratio of 18.1 is below the 20-year average P/E ratio of 19.2 but above the longer-term average P/E ratio of 16.7. The current P/S ratio of 1.8 is greater than the 20-year average P/S ratio of 1.5 and is higher than it has been at any point since 2000.
As seen in the chart, the P/S ratio has grown at a much steeper rate than the P/E ratio during the past few years. Over this period, the growth in earnings per share of the S&P 500 has significantly outpaced the growth in sales per share. This tells us that cuts to bottom line expenses — not growth in top line revenues — have been the primary driver of earnings growth. It is fairly typical for this scenario to occur, especially in the early stages of a bull market, as companies tend to cut expenses in order to remain profitable following downturns in the economy. However, in order for earnings growth to be sustained over longer periods of time, there needs to be a pickup in sales growth, as there are limits to expenditure cuts. This is especially concerning because current forecasts indicate that the market expects negative sales growth for both the first and second quarters of 2015. To be sure, this may just be a statistical quirk caused by the significant drop in oil prices in recent months, but it bears monitoring nonetheless.

The opinions expressed herein are those of Marquette Associates, Inc. (“Marquette”), and are subject to change without notice. This material is not financial advice or an offer to purchase or sell any product. Marquette reserves the right to modify its current investment strategies and techniques based on changing market dynamics or client needs.
01.12.2026
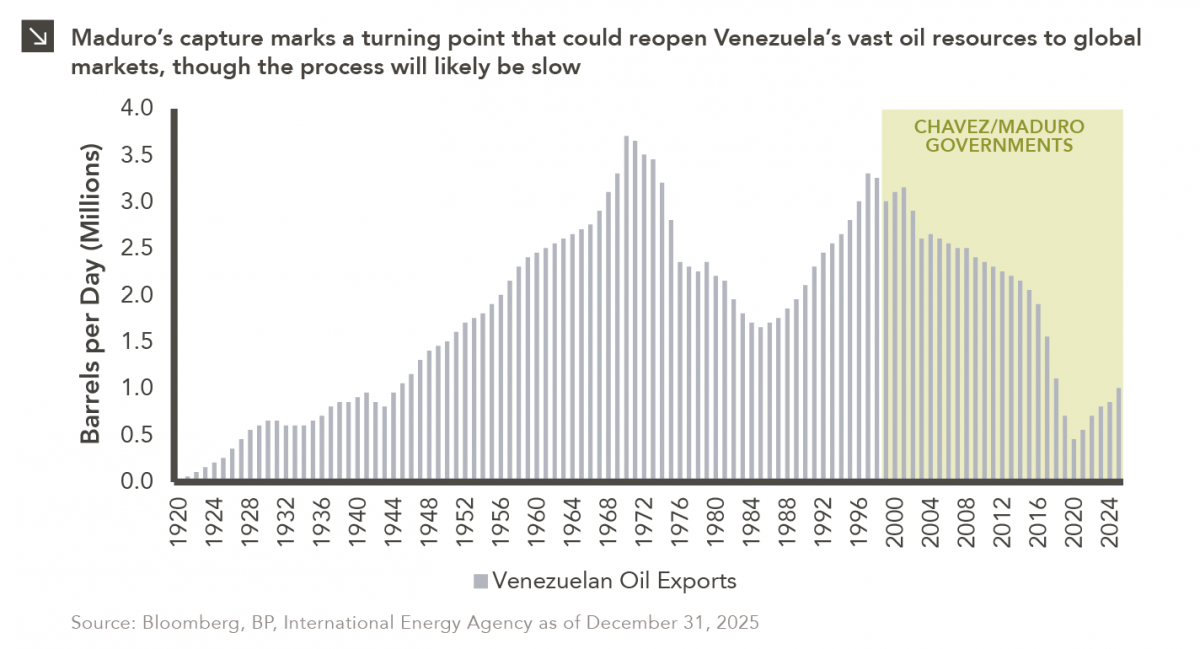
The capture of Venezuelan president Nicolás Maduro is a watershed moment for a country whose natural resource economy has been…

01.07.2026
Please join Marquette’s research team for our 2026 Market Preview Webinar analyzing 2025 across the economy and various asset classes…

01.05.2026
The development of artificial intelligence is advancing along two largely distinct paths. The first centers on generative AI powered by…
12.29.2025
While the holiday season was once marked by bustling bars, readers may notice that nightlife isn’t what it used to…
12.22.2025
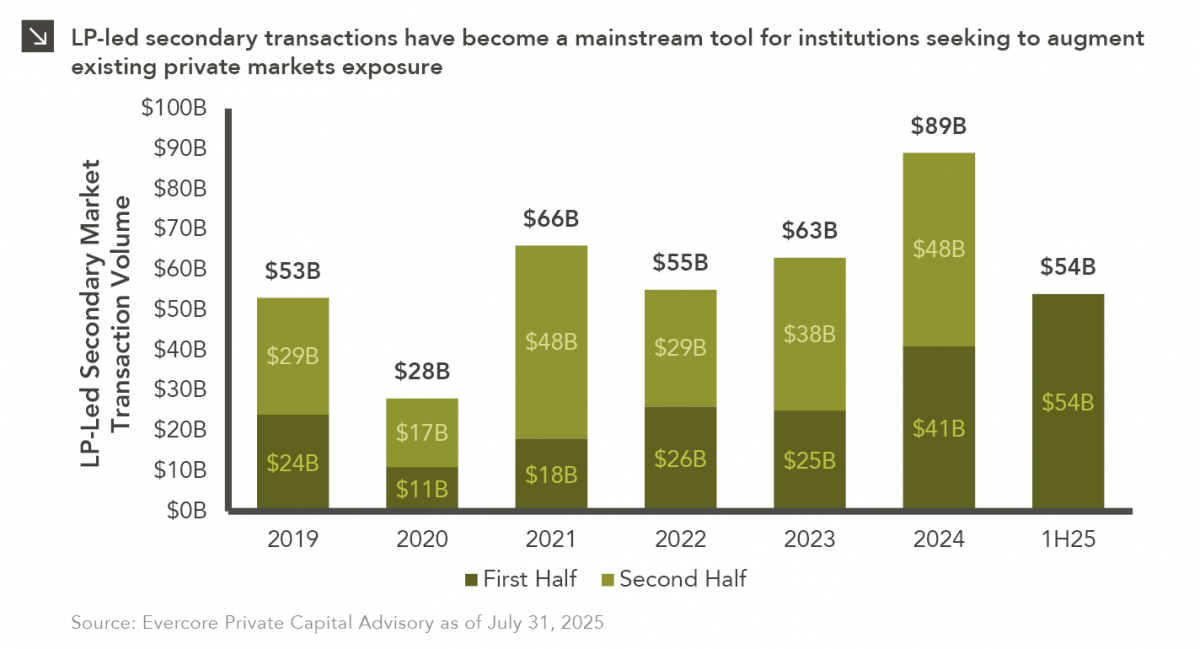
Private equity is known for being an illiquid asset class, with investments typically locked up for several years and limited…

12.15.2025
While technology-oriented firms have made their presence known in equity markets for several years, these companies have made waves in…
Research alerts keep you updated on our latest research publications. Simply enter your contact information, choose the research alerts you would like to receive and click Subscribe. Alerts will be sent as research is published.
We respect your privacy. We will never share or sell your information.
If you have questions or need further information, please contact us directly and we will respond to your inquiry within 24 hours.
Contact Us >