Greg Leonberger, FSA, EA, MAAA, FCA
Partner, Director of Research


When it comes to baseball, successful hitters have little trouble hitting the ball when they know what pitch is coming. But when pitchers can vary the speed as well as the spin and curve of the ball, hitting becomes exponentially more difficult. An effective curveball can make even the most accomplished hitter look feeble.
As we look at the second half of 2024, we are reminding our clients to “keep their eye on the ball.” Indeed, the first half of the year has been pretty “hittable” as far as returns are concerned, with the majority of asset classes positive through June 30. However, curveballs such as Fed policy, equity index concentration, exchange rates, and a capricious election could quickly flip the script and send investors back to the dugout shaking their heads.
With that said, here is our scouting report for the second half of the year, organized by asset class. We share not only “down the middle” themes but also the curveballs that could flummox performance. A well-prepared investor is no different than a well-prepared baseball player: Insight and realistic expectations provide the foundation for a successful season!
Read > Keep Your Eye on the Ball
The opinions expressed herein are those of Marquette Associates, Inc. (“Marquette”), and are subject to change without notice. This material is not financial advice or an offer to purchase or sell any product. Marquette reserves the right to modify its current investment strategies and techniques based on changing market dynamics or client needs.
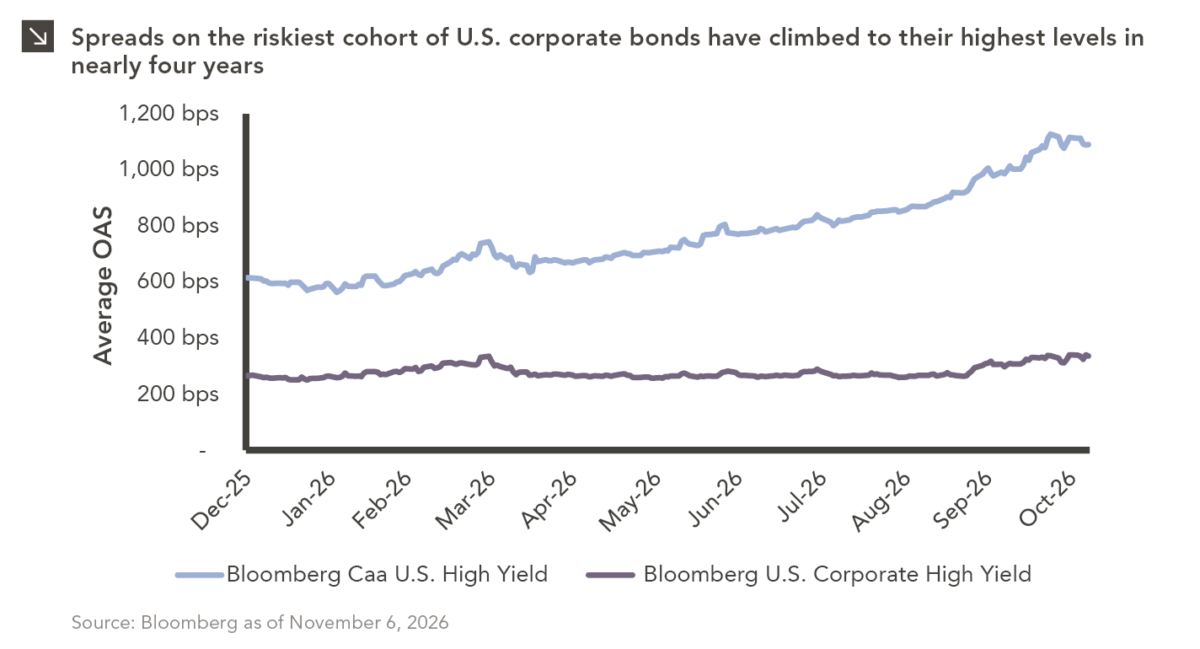
11.09.2026
The U.S. distressed debt market is showing increasingly pronounced signs of stress. As of this writing, option-adjusted spreads on CCC-rated…
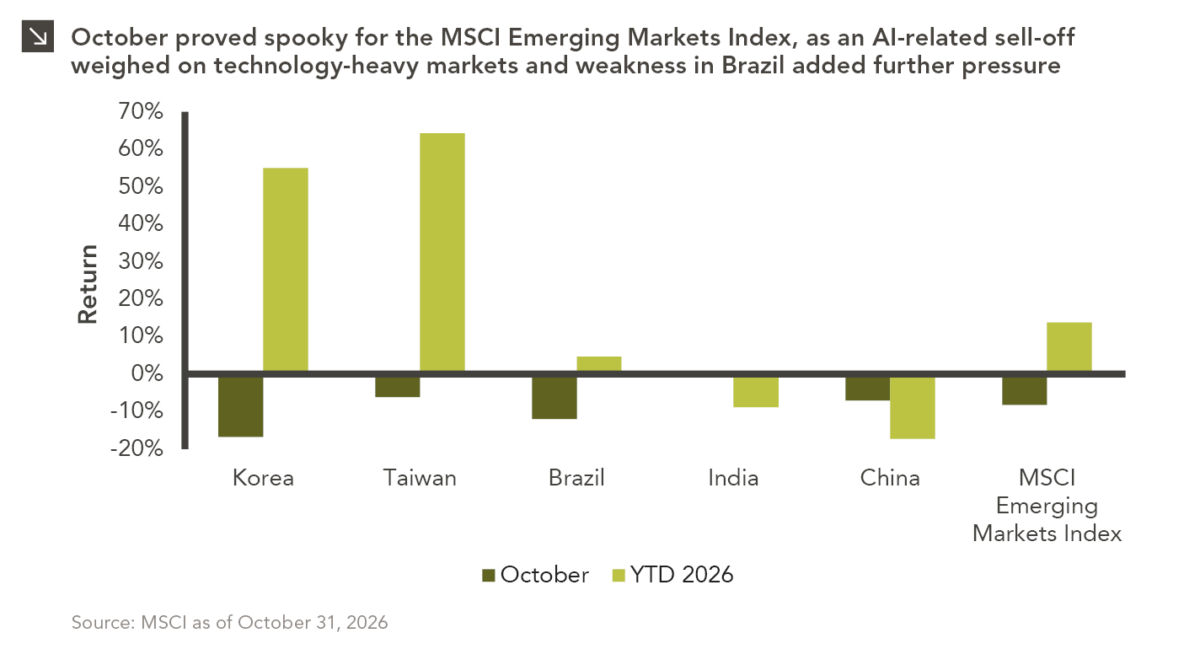
11.02.2026
Emerging markets faced a challenging October, with the space declining by around 8.3% amid renewed concerns over the sustainability of…
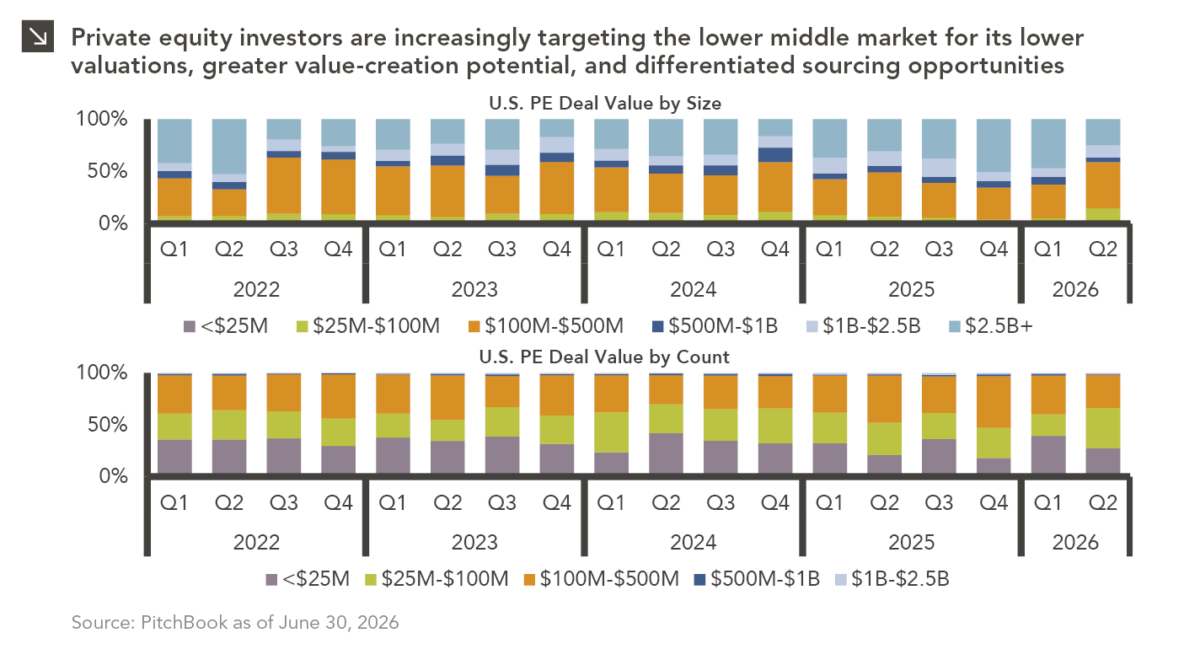
10.26.2026
Private equity activity is increasingly shifting toward smaller transactions, with total deal value for transactions of $100 million or less…

10.08.2026
This video is a recording of a live webinar held October 22 by Marquette’s research team analyzing the third quarter…
10.22.2026
Anyone who has run a marathon knows the last six miles are brutal — no matter how well the first…
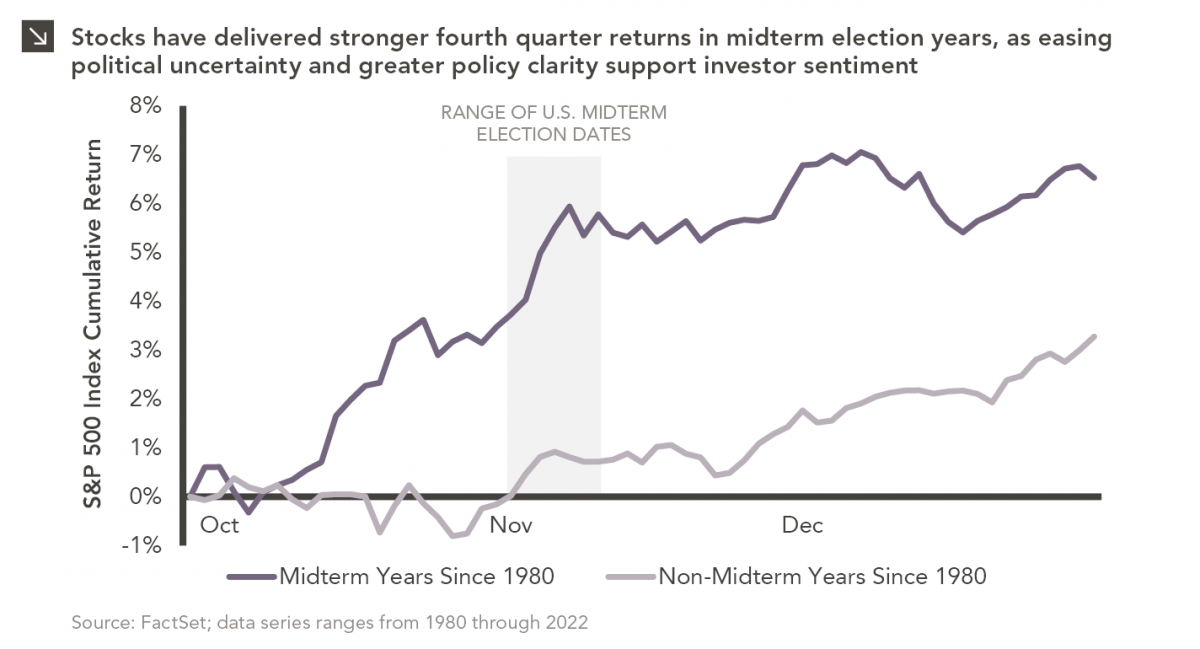
10.19.2026
Since 1980, the S&P 500 Index has generally performed well in the weeks surrounding U.S. midterm elections. Specifically, the index…
Research alerts keep you updated on our latest research publications. Simply enter your contact information, choose the research alerts you would like to receive and click Subscribe. Alerts will be sent as research is published.
We respect your privacy. We will never share or sell your information.
If you have questions or need further information, please contact us directly and we will respond to your inquiry within 24 hours.
Contact Us >