11.24.2025
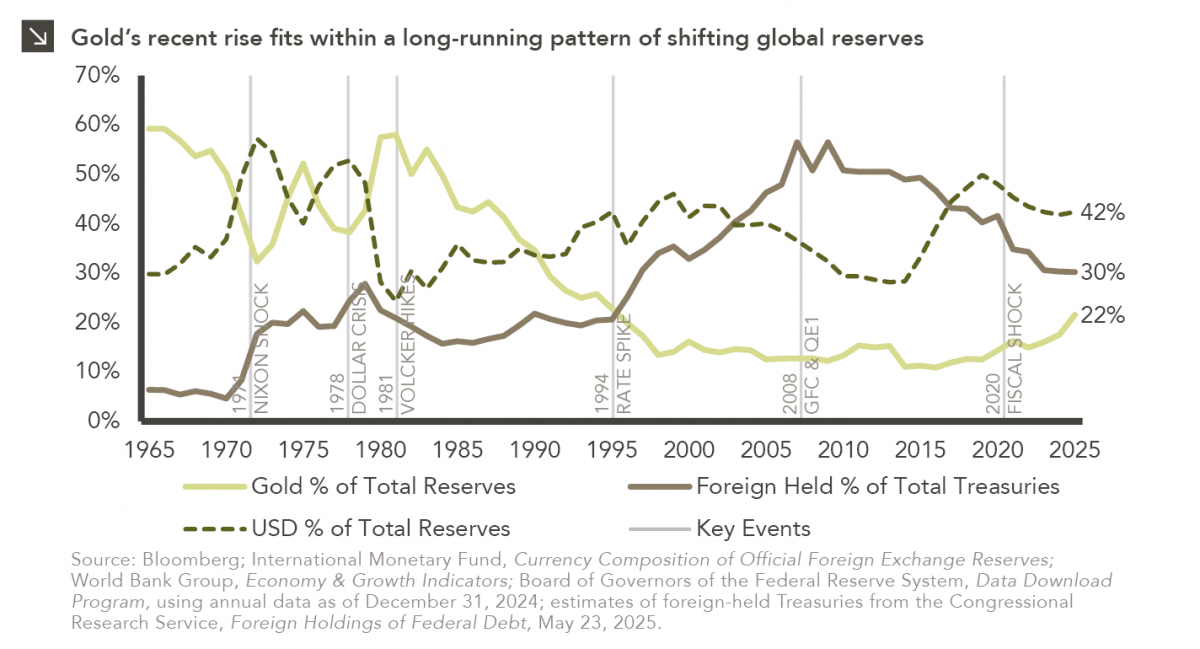
Don’t Call It a Comeback, Gold’s Been Here for Years
With gold now trading near $4,000 per ounce after a steady multi-year climb, investor attention has turned to the potential…
Last week, the Federal Reserve agreed to continue purchasing mortgage backed securities, expanding its holdings of Treasury securities and keeping short-term interest rates near zero until the unemployment rate is below 6.5% and inflation remains under 2.5%.
The unemployment rate has declined from 8.5% at the end of 2011 to 7.7% as of November 2012. On average, the economy has added approximately 150,000 jobs per month in 2012. While 150,000 jobs is a positive figure, it has not been the only driver in reducing the unemployment rate. A drop in the labor participation rate has been the other factor in the declining unemployment rate.
The chart above illustrates the labor force participation rate from January 1948-November 2012. Note that the rate grew precipitously from the 1960’s through the late 1990’s based upon the secular trend of women entering the workforce. Cyclical changes such as recessions have traditionally led to declines as unemployed workers temporarily leave the workforce.
In December 2007, the participation rate was 66%; today it is 63.6%. Now that the Federal Reserve has tied its economic policies to specific unemployment figures, it is difficult to determine if the labor force participation rate declines are cyclical or secular changes. Are the declines due to the baby boomer generation retiring or the younger population staying in school longer? Conversely, are the declines due to a disproportionate amount of discouraged workers who have given up on the job search?
According to the Bureau of Labor Statistics, there are 12 million unemployed and 2.5 million marginally employed. Depending on if and when the marginally employed begin searching for jobs, there may be an uptick in unemployment if job growth cannot accommodate their reentrance and population growth. Given these facts, it may be difficult for the Federal Reserve to achieve its goal of 6.5% unemployment by 2015 without an uptick in the economy.
The opinions expressed herein are those of Marquette Associates, Inc. (“Marquette”), and are subject to change without notice. This material is not financial advice or an offer to purchase or sell any product. Marquette reserves the right to modify its current investment strategies and techniques based on changing market dynamics or client needs.
11.24.2025
With gold now trading near $4,000 per ounce after a steady multi-year climb, investor attention has turned to the potential…
11.17.2025
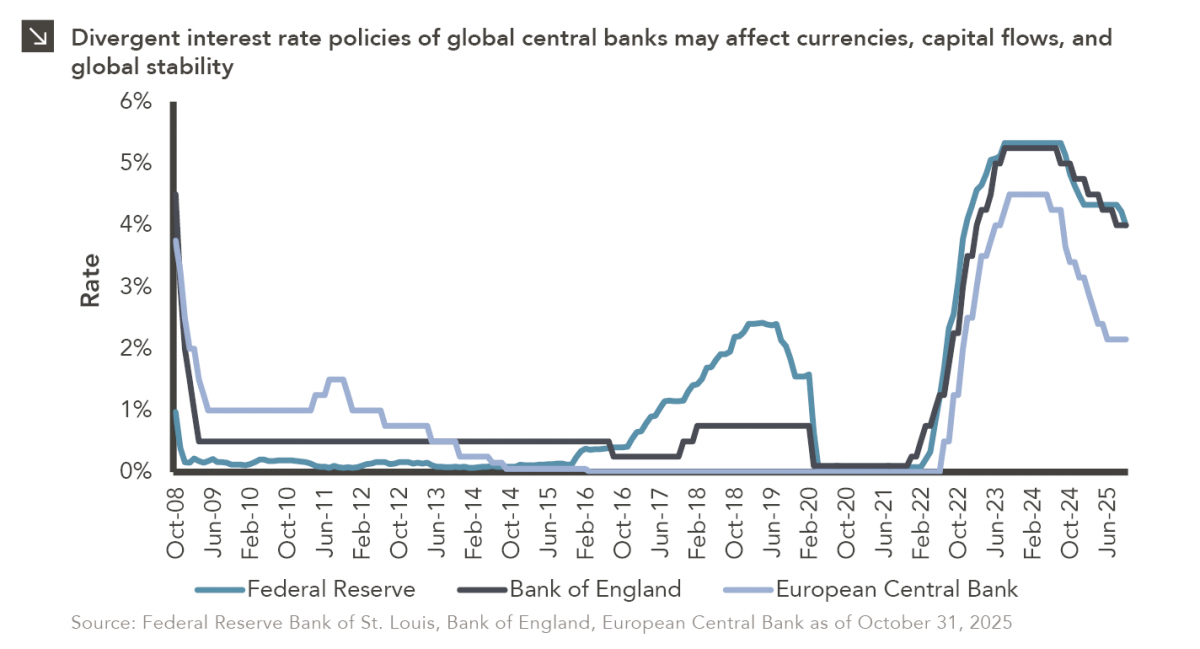
After a largely synchronized hiking cycle beginning in 2022, there has been a slight divergence in interest rate policies across…
11.10.2025
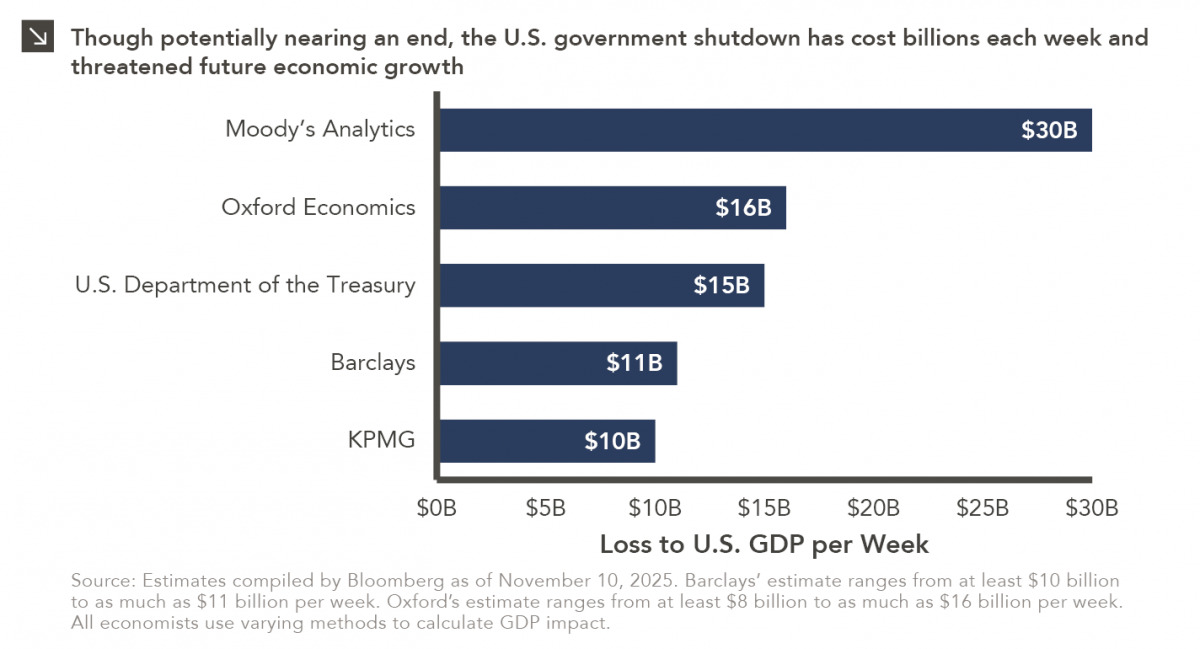
Over the weekend, the Senate overcame a key procedural obstacle in its attempt to end the record-breaking government shutdown, as…
11.03.2025
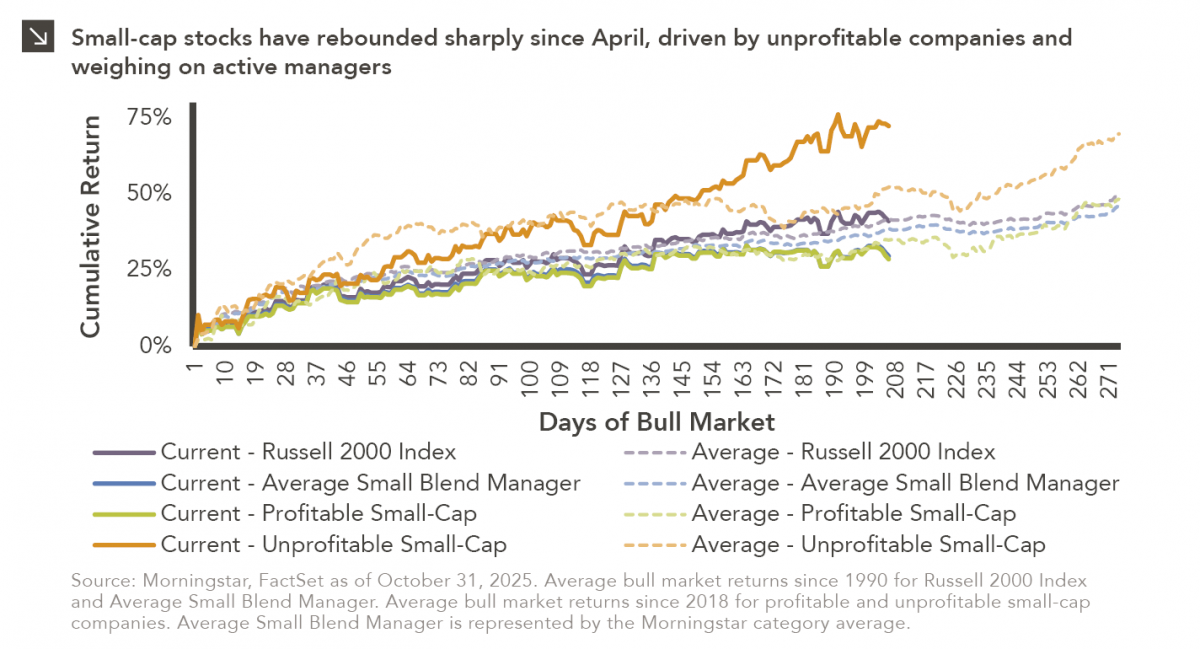
Small-cap equities are in a prolonged period of underperformance relative to large-cap stocks, but this trend has shown early signs…
10.27.2025
To paraphrase a quote from former President George W. Bush: “Fool me once, shame on… shame on you. Fool me…

10.22.2025
This video is a recording of a live webinar held October 22 by Marquette’s research team analyzing the third quarter…
Research alerts keep you updated on our latest research publications. Simply enter your contact information, choose the research alerts you would like to receive and click Subscribe. Alerts will be sent as research is published.
We respect your privacy. We will never share or sell your information.
If you have questions or need further information, please contact us directly and we will respond to your inquiry within 24 hours.
Contact Us >