Nat Kellogg, CFA
President
Since 1980 the three most volatile cyclical components of GDP have been “change in private inventories”, “fixed investment in non residential structures”, and “fixed investment in residential structures”. While these three categories make up only 8% of GDP, they have historically accounted for almost 60% of any negative change in GDP during a recession.
Recent economic data indicate that the risk of recession in the U.S. has increased substantially over the last three months. However, one major difference as the chart shows, is that these components of GDP (“change in private inventories”, “fixed investment in non residential structures”, and “fixed investment in residential structures”), which typically are the key drivers of a cyclical downturn, are not anywhere close to the peak levels that are often seen leading up to a recession. In fact, “fixed investment in nonresidential structures” is almost one standard deviation below normal, “fixed investment in residential structures” is more than two standard deviations below normal, and “change in private inventories” is roughly in line with historic norms.
While this does not mean that the US cannot slide into recession in the coming months, it does mean that any recession is likely to look very different from the prior recessions the US has experienced since 1980. Since any recession is usually positive for net exports (as we saw in 2008), and given that the normal drivers of recession discussed above are already unusually low, a recession is likely to be driven by a drop in Government Consumption Expenditure or Personal Consumption Expenditure. These two components made up 91.4% of GDP in 2Q2011, but have historically been two of the most stable components of GDP.
As a result it seems likely that if a recession occurs over the next 12 months, it will be driven by lower consumer or government spending. However, since these components tend to be very stable, both a deep recession or a rapid recovery seem unlikely.

The opinions expressed herein are those of Marquette Associates, Inc. (“Marquette”), and are subject to change without notice. This material is not financial advice or an offer to purchase or sell any product. Marquette reserves the right to modify its current investment strategies and techniques based on changing market dynamics or client needs.
10.06.2025
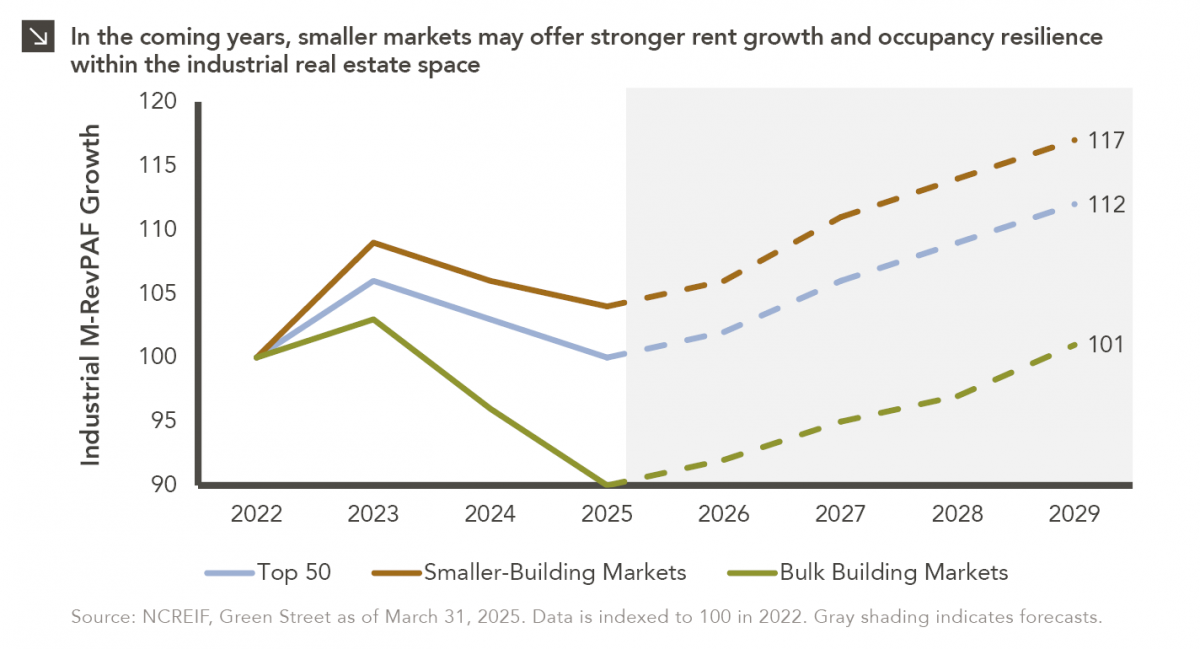
This week’s chart compares realized and expected Market Revenue per Available Foot (“M-RevPAF”) growth within the industrial real estate space…

10.03.2025
Watch the flash talks from Marquette’s 2025 Investment Symposium livestream on September 26 in the player below — use the…

10.01.2025
Please join Marquette’s research team for our 3Q 2025 Market Insights Webinar analyzing the third quarter across the…

09.29.2025
Trifecta status for a state exists when a single political party holds the governor’s seat and a majority in both…

09.22.2025
Barring a significant equity market drawdown in the coming weeks, the current bull market will turn three years old in…
09.15.2025
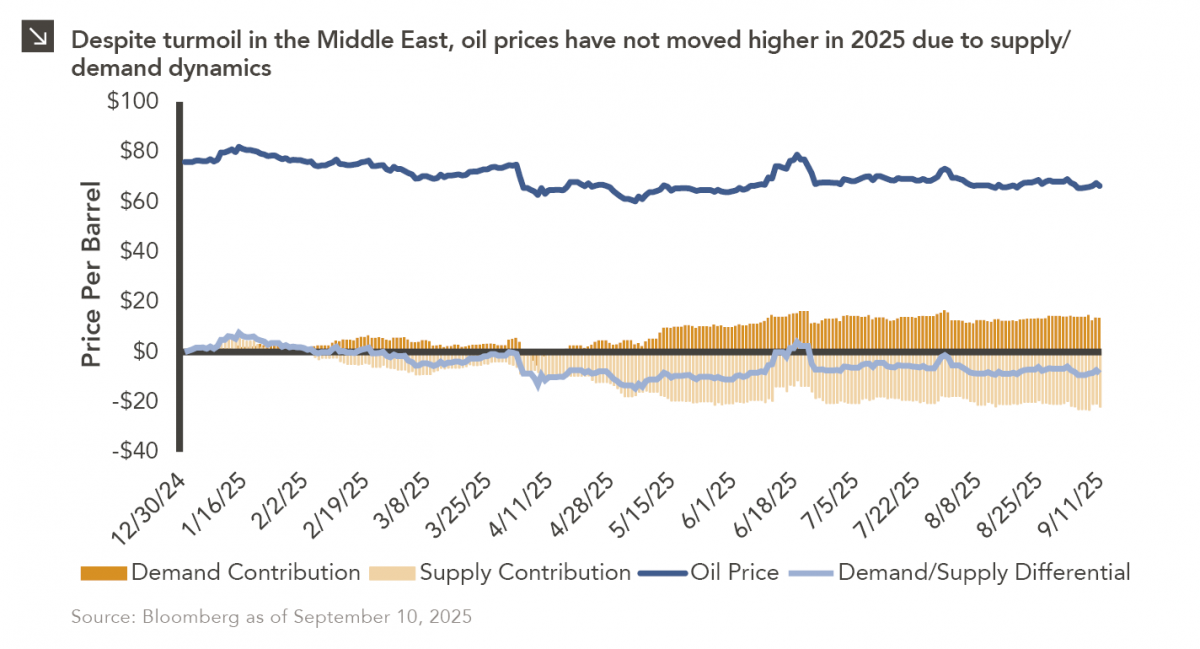
Earlier this year, Marquette published a Chart of the Week that detailed the muted change in oil…
Research alerts keep you updated on our latest research publications. Simply enter your contact information, choose the research alerts you would like to receive and click Subscribe. Alerts will be sent as research is published.
We respect your privacy. We will never share or sell your information.
If you have questions or need further information, please contact us directly and we will respond to your inquiry within 24 hours.
Contact Us >