Greg Leonberger, FSA, EA, MAAA, FCA
Partner, Director of Research


Although this is only the second iteration of my quarterly letter series, Marquette has always produced quarterly market narratives in one shape or another. And in almost all cases, it has been relatively straightforward to formulate a narrative that stitches together the primary headlines from the prior three months. But as I sit here today, things seem quiet…too quiet, almost. Of course, it is the first summer after a crippling global pandemic that shuttered the economy and constrained us almost exclusively to our homes for the better part of the year. Summer is in full swing and the images of crowded beaches overlaid with higher prices for airline tickets and hotel stays illustrate that people are getting back to their pre-pandemic lifestyles, both socially and economically. Anecdotally, my email volume slowed over the last quarter as well; whether this is pure coincidence or a function of markets generally behaving in conjunction with economic re-openings and summer vacations remains to be seen.
Nonetheless, the purpose of this letter series is to track the pulse of the financial markets and let our readers know what we’re thinking about (worrying about?) when looking at the overall financial market landscape. Given that objective, the following outlines several market factors that we believe bear monitoring as the remainder of the year plays out.
Highlights from this edition:
Read > Have Things Been Too Quiet?

The opinions expressed herein are those of Marquette Associates, Inc. (“Marquette”), and are subject to change without notice. This material is not financial advice or an offer to purchase or sell any product. Marquette reserves the right to modify its current investment strategies and techniques based on changing market dynamics or client needs.
10.26.2026
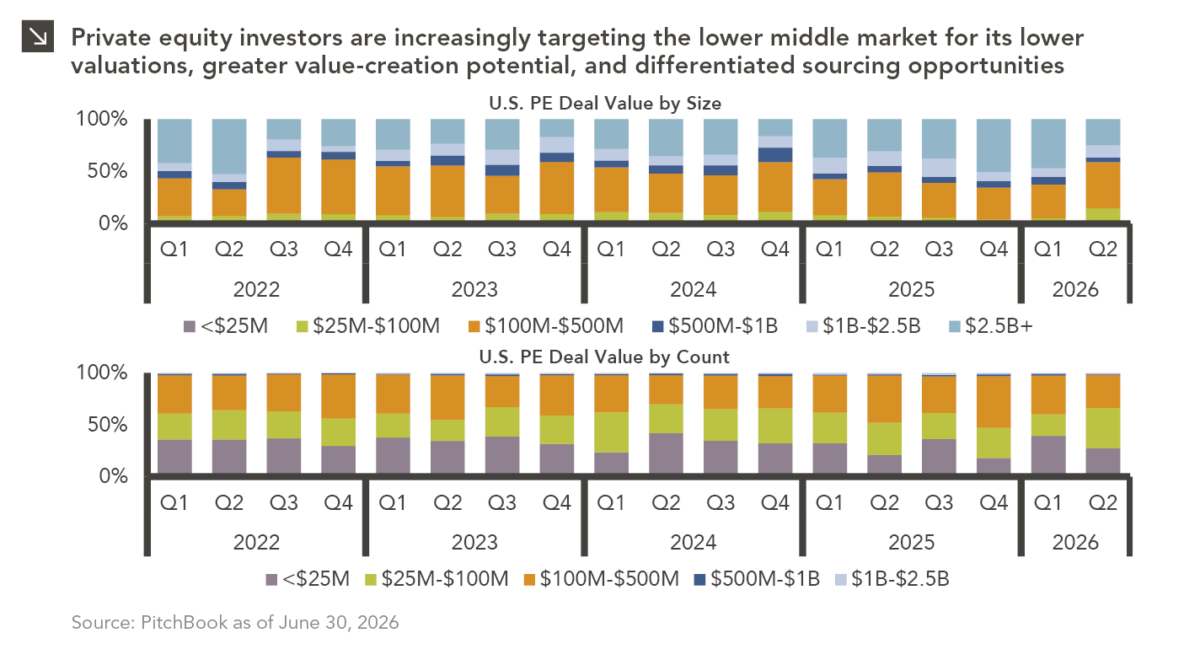
Private equity activity is increasingly shifting toward smaller transactions, with total deal value for transactions of $100 million or less…

10.08.2026
This video is a recording of a live webinar held October 22 by Marquette’s research team analyzing the third quarter…
10.22.2026
Anyone who has run a marathon knows the last six miles are brutal — no matter how well the first…

10.19.2026
Since 1980, the S&P 500 Index has generally performed well in the weeks surrounding U.S. midterm elections. Specifically, the index…

10.05.2026
For investors, the spookiest thing about October might not be the ghosts and monsters that are bound to show up…

09.28.2026
The phrase “expectations of higher inflation” has become a staple in financial news to explain the increase in nominal U.S….
Research alerts keep you updated on our latest research publications. Simply enter your contact information, choose the research alerts you would like to receive and click Subscribe. Alerts will be sent as research is published.
We respect your privacy. We will never share or sell your information.
If you have questions or need further information, please contact us directly and we will respond to your inquiry within 24 hours.
Contact Us >