Greg Leonberger, FSA, EA, MAAA, FCA
Partner, Director of Research
In the last four months of 2010, the price of oil rose from $72 as of August 31st to $91 as of December 31st, an increase of 26%. Over that same time period, the breakeven rate (the difference in yield between the ten year TIP and ten year nominal treasury) increased 34%, from 1.68% to 2.25%. Because the breakeven rate is commonly used as a proxy for inflation expectation, it is not a stretch to think that the run up in oil prices was driving inflation expectations (and inevitably, stories of “rising inflation” always seem to appear shortly after the price of oil shoots up). This week’s Chart of the Week compares inflation expectations (measured by the breakeven rate) with oil prices, to see if there really is a strong correlation between the two values. The blue bars represent the price of oil at the end of each month, and the red line chronicles the breakeven rate at each month end; data is used going back to 2003. Between 2003 and 2007, there seems to be a loose connection between the two, but it is not very tight, as the price of oil slowly creeps up but the breakeven rate is relatively static. From late 2008 through the end of 2010, the graphs seem to mirror each other more closely, most especially in late 2010. In total, however, the correlation is only .18, thus we conclude that the price of oil does not have a strong impact on expected inflation values, in spite of what we hear and read when oil prices rise dramatically.

The opinions expressed herein are those of Marquette Associates, Inc. (“Marquette”), and are subject to change without notice. This material is not financial advice or an offer to purchase or sell any product. Marquette reserves the right to modify its current investment strategies and techniques based on changing market dynamics or client needs.

01.07.2026
This video is a recording of a live webinar held January 15 by Marquette’s research team analyzing 2025 across the…
01.12.2026
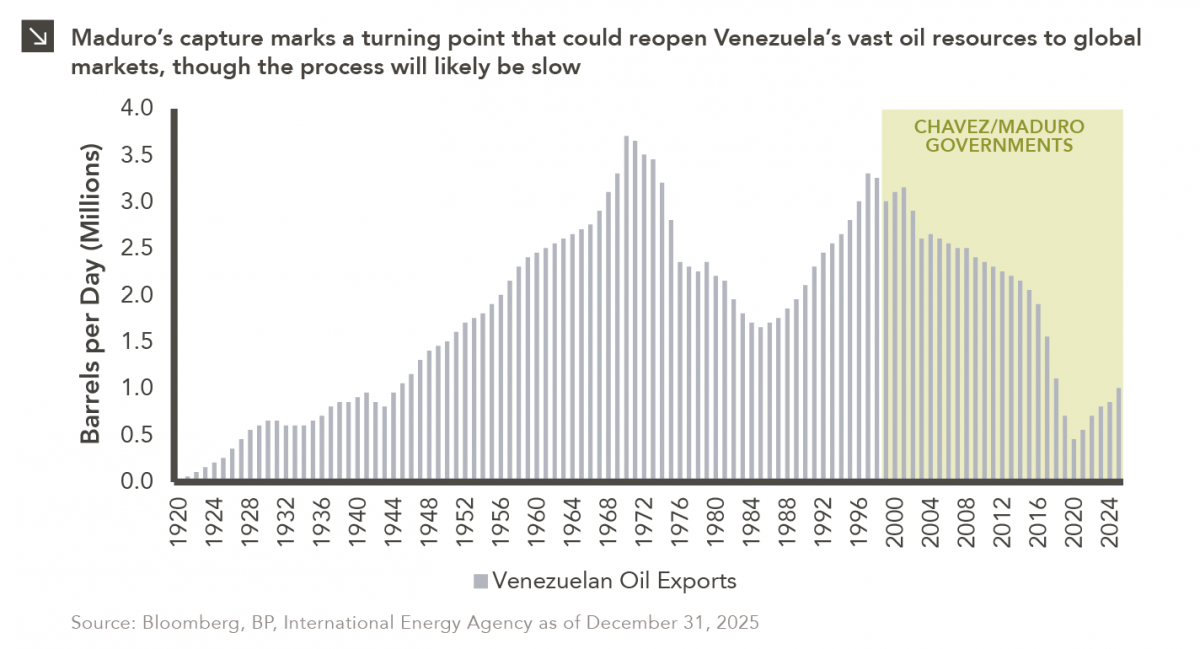
The capture of Venezuelan president Nicolás Maduro is a watershed moment for a country whose natural resource economy has been…

01.05.2026
The development of artificial intelligence is advancing along two largely distinct paths. The first centers on generative AI powered by…
12.29.2025
While the holiday season was once marked by bustling bars, readers may notice that nightlife isn’t what it used to…
12.22.2025
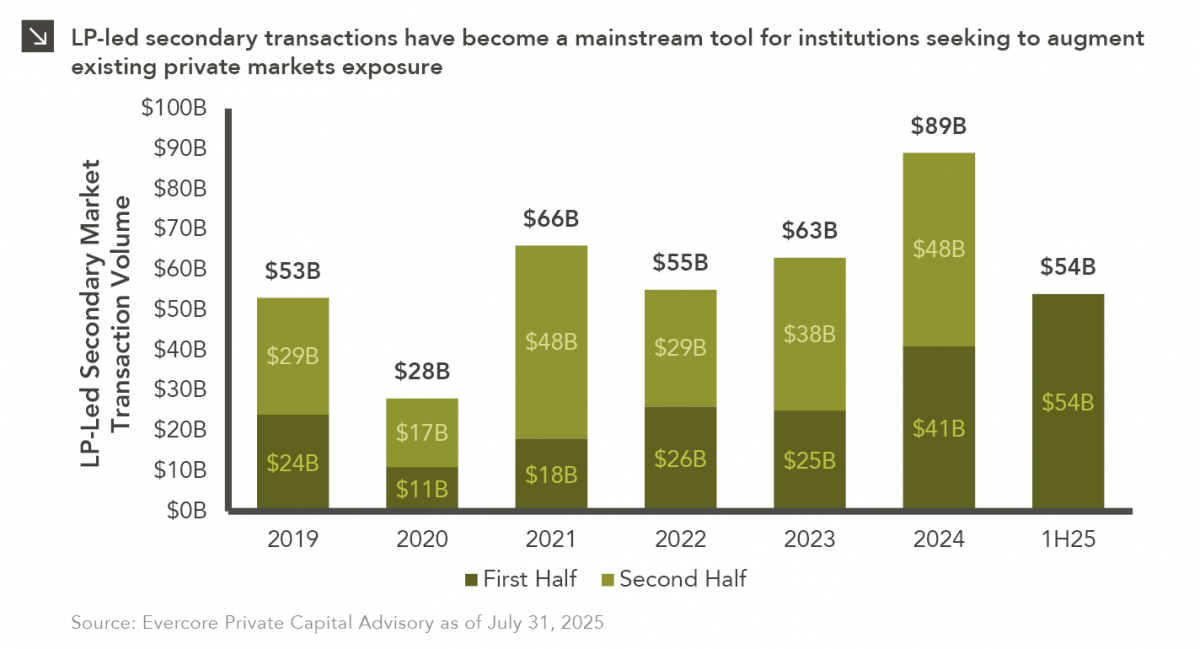
Private equity is known for being an illiquid asset class, with investments typically locked up for several years and limited…

12.15.2025
While technology-oriented firms have made their presence known in equity markets for several years, these companies have made waves in…
Research alerts keep you updated on our latest research publications. Simply enter your contact information, choose the research alerts you would like to receive and click Subscribe. Alerts will be sent as research is published.
We respect your privacy. We will never share or sell your information.
If you have questions or need further information, please contact us directly and we will respond to your inquiry within 24 hours.
Contact Us >