Greg Leonberger, FSA, EA, MAAA, FCA
Partner, Director of Research
Anyone who has gone snowmobiling knows it can be simultaneously exhilarating and terrifying. Throttling across snow and through a forest powered by a 75-horsepower engine with two plastic skis to steer makes it hard to feel like one has complete control; 30 mph in the open air feels more like 100!
Nonetheless, operating a snowmobile is pretty straightforward: The throttle is a right-thumb button, the brake is a left-hand squeeze lever. Beyond those two controls, it’s up to the driver to effectively navigate the trail, with the critical concession that the terrain is out of anyone’s complete control. Which brings me to our 2026 market outlook.
The “throttles” for portfolios are the usual constituents: equities, below investment grade credit, and private markets. The “brakes” are investment grade fixed income, particularly Treasuries which can slow a portfolio’s losses if the market tumbles. The terrain is naturally the actual path that each of these asset classes will follow in 2026. Since 2022 the equity market ride has been mostly exhilarating, save for some of the terrifying moments like the market dip after Liberation Day. But that’s in the rearview mirror, and the focus is what is around the bend. Will the thrill continue, or should we ease up on the throttle?
Read > Seventy-Five Horses and Two Pieces of Plastic
The opinions expressed herein are those of Marquette Associates, Inc. (“Marquette”), and are subject to change without notice. This material is not financial advice or an offer to purchase or sell any product. Marquette reserves the right to modify its current investment strategies and techniques based on changing market dynamics or client needs.
04.01.2026
Fixed income is the largest global financial market and often one of the largest allocations within institutional investors’ portfolios. A…
03.30.2026
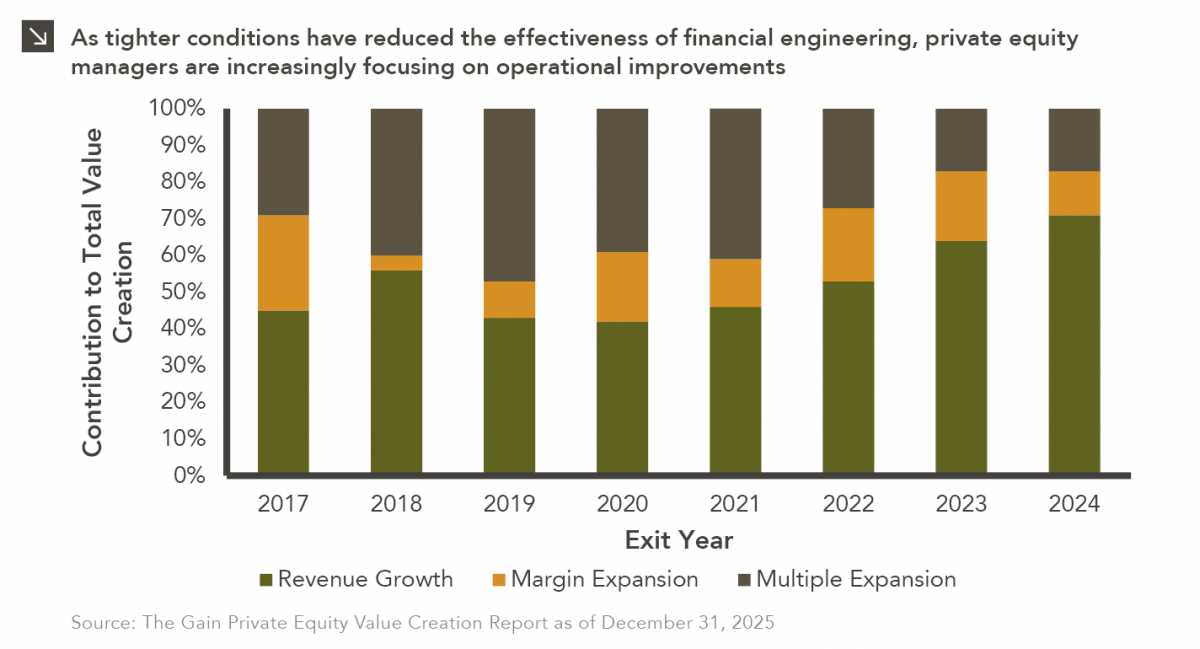
In the period between 2009 and 2022, private equity managers thrived amid an environment of low interest rates and rising…

03.23.2026
Global energy costs have risen sharply this month due to a convergence of geopolitical shocks, as critical infrastructure and transport…

03.16.2026
This week’s chart illustrates a clear structural shift in the fundraising dynamics of North American closed-end real estate funds over…

03.09.2026
Warren Buffett once implored investors to “be greedy when others are fearful,” and this sage advice is certainly applicable to…

03.02.2026
Recent market dynamics in the software sector reflect a sharp shift in investor sentiment driven primarily by concerns that advances…
Research alerts keep you updated on our latest research publications. Simply enter your contact information, choose the research alerts you would like to receive and click Subscribe. Alerts will be sent as research is published.
We respect your privacy. We will never share or sell your information.
If you have questions or need further information, please contact us directly and we will respond to your inquiry within 24 hours.
Contact Us >