Annie Huang
Research Analyst


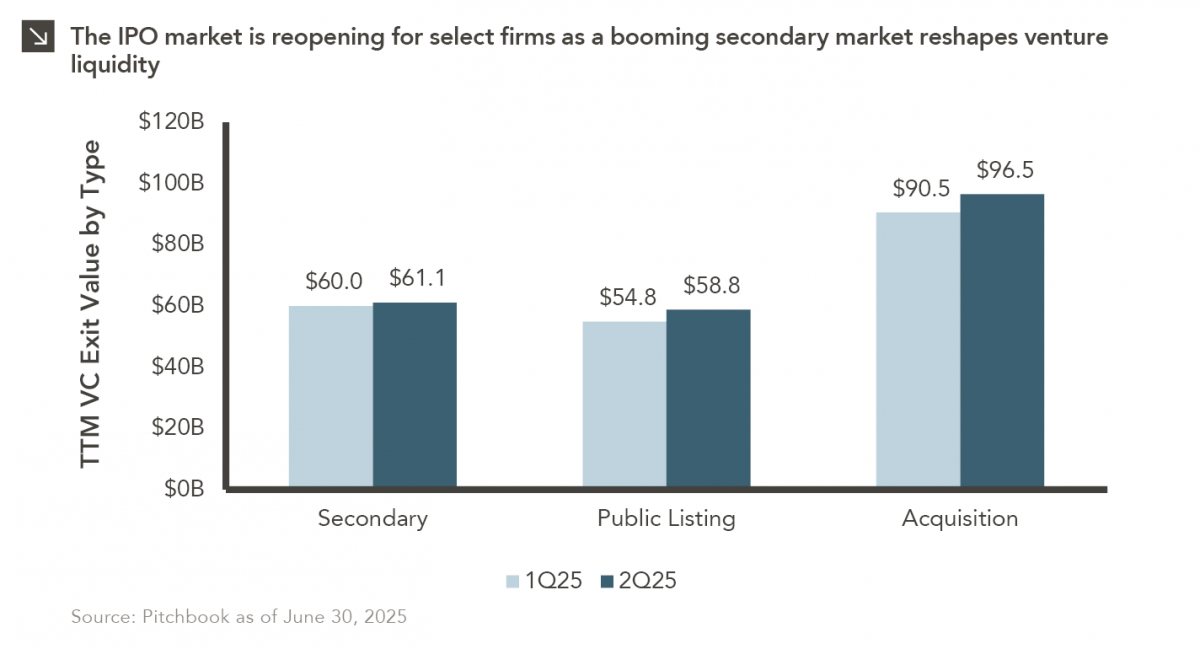
After a three-year drought, the IPO market is stirring again… but only for a select few. Just 18 companies have gone public in the U.S. through the end of June, which puts 2025 on pace to be the slowest year for IPOs in a decade (though total exit value this year has already surpassed 2024 levels). The companies that have listed thus far in 2025 have looked markedly stronger from a fundamental standpoint than those in the 2021 cohort. Indeed, nearly a quarter are profitable, with average revenues above $800 million and median valuation-to-revenue multiples around 4x (down from roughly 17x a few years earlier). This new IPO class has clustered around themes like artificial intelligence, cryptocurrency, defense, and space, all of which have been buoyed by government policy and widespread investor interest in growth.
This being said, the secondary market has quietly become a powerful alternative source of liquidity that has reshaped the venture capital ecosystem. According to PitchBook, U.S. venture secondary transactions reached $61.1 billion over the past year, slightly exceeding VC-backed IPO exit value and accounting for nearly one-third of all venture exits. “Mega-unicorns” such as SpaceX, Stripe, Databricks, and OpenAI have actively launched tender offers and secondary SPVs to provide liquidity for employees and investors while remaining private enterprises. The secondary market has expanded rapidly in recent years, with dedicated dry powder reaching $8.2 billion in 2024 (up from roughly $4 billion in 2022) and SPV capital raising surging more than tenfold. Still, despite this remarkable growth, secondary exit value remains a small slice of the venture ecosystem at just 1.9% of total unicorn market value.
The result of these dynamics is a tale of two markets: One public and highly selective, the other private, flexible, and increasingly institutionalized. While acquisitions continue to account for most venture exits by volume, the evolving dynamic between IPOs and secondaries is redefining how liquidity is delivered to investors… and redefining what “going public” really means in today’s venture landscape.
Print PDF
The opinions expressed herein are those of Marquette Associates, Inc. (“Marquette”), and are subject to change without notice. This material is not financial advice or an offer to purchase or sell any product. Marquette reserves the right to modify its current investment strategies and techniques based on changing market dynamics or client needs.

10.12.2026
This week’s chart highlights the accelerating growth of electricity demand in the U.S., which has been driven primarily by the…

10.08.2026
LIVE WEBINAR — OCTOBER 22 Please join Marquette’s research team for our 3Q 2026 Market Insights Webinar…

10.05.2026
For investors, the spookiest thing about October might not be the ghosts and monsters that are bound to show up…

09.28.2026
The phrase “expectations of higher inflation” has become a staple in financial news to explain the increase in nominal U.S….

09.21.2026
For much of the past several years, the conventional view has been that higher interest rates and stretched valuations would…

09.15.2026
Over the past decade, continuation vehicles (“CV”) have become one of the fastest-growing trends in private equity. Private equity funds…
Research alerts keep you updated on our latest research publications. Simply enter your contact information, choose the research alerts you would like to receive and click Subscribe. Alerts will be sent as research is published.
We respect your privacy. We will never share or sell your information.
If you have questions or need further information, please contact us directly and we will respond to your inquiry within 24 hours.
Contact Us >