04.02.2026
1Q 2026 Market Insights Webinar
Please join Marquette’s research team for our 1Q 2026 Market Insights Webinar analyzing the first quarter across the economy and various…
The Financial Stability Board (“FSB”) recently released a list of global systemically important financial institutions (“SIFIs”). Based on information from its website, the FSB was established in 2009 and acts to promote financial stability. The current Chair of the FSB is Mario Draghi, the new head of the European Central Bank (“ECB”).
SIFIs are financial institutions deemed large and complex enough that their failure would cause ripple effects throughout the financial system. Of the twenty-nine banks on the FSB’s list, nine are American, and seventeen are European. The full list is shown below:
Asia
Europe
North America
This week’s chart shows CDS spreads on SIFIs of select countries. For countries with multiple banks on the list, the average CDS spread of available data is taken.
Rises in the CDS spreads of SIFIs represent growing concerns about systemic risk. Because these financial institutions are large, opaque, and interconnected, rising investor worries about the European debt crises can lead to rising investor concern about the financial health of SIFIs.
As seen in the chart, CDS spreads on Italian banks (Unicredit) began to widen in June. In July, 10-year yields on Italian government debt leapt from 5.0% to nearly 6.0%. The ECB began purchasing Italian bonds on August 8, quickly bringing 10-year Italian yields back down to 5.0%. CDS Spreads on Italian banks continued to rise, however, ending August up 43 bps.
In August, despite the apparent effectiveness of the ECB’s intervention, CDS spreads on U.S., French, German, and Swiss SIFIs increased dramatically. CDS spreads on Spanish and UK SIFIs increased from already elevated levels. French banks, for example, entered August with CDS spreads of 168.6 bps. They ended September up over 100 bps, at 281.9.
During this time, risk assets were pummeled, with the S&P 500 dropping 14.2% in August and September. High yield spreads widened from 540 bps to over 800 bps. Since September, both stocks and high yield bonds have recovered significantly, though high yield spreads remain elevated. Importantly, while CDS spreads on SIFIs are below their peaks, they are still much higher than they were in July. This indicates that despite the recovery in risk assets, investors are still wary of global systemic risk.
In this environment, all risk assets are exposed to global event risk, likely emanating from the EU. For example, the wrong headline out of Greece or Italy could ripple through the global economy causing drops in U.S. stock and corporate bond prices. Financials remain high risk, with potentially high reward. As Jeffries showed, investors may sell first and ask questions later. Attractive opportunities to add risk may present themselves, as the baby gets thrown out with the bathwater.
The opinions expressed herein are those of Marquette Associates, Inc. (“Marquette”), and are subject to change without notice. This material is not financial advice or an offer to purchase or sell any product. Marquette reserves the right to modify its current investment strategies and techniques based on changing market dynamics or client needs.

04.02.2026
Please join Marquette’s research team for our 1Q 2026 Market Insights Webinar analyzing the first quarter across the economy and various…
03.30.2026
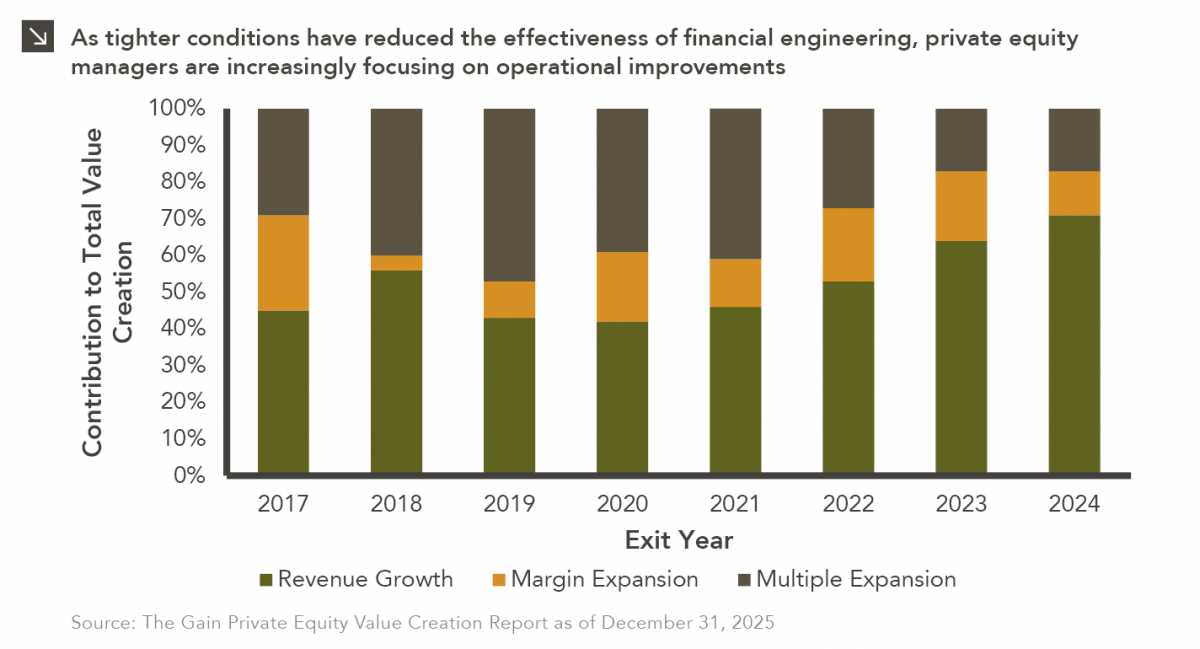
In the period between 2009 and 2022, private equity managers thrived amid an environment of low interest rates and rising…

03.23.2026
Global energy costs have risen sharply this month due to a convergence of geopolitical shocks, as critical infrastructure and transport…

03.16.2026
This week’s chart illustrates a clear structural shift in the fundraising dynamics of North American closed-end real estate funds over…

03.09.2026
Warren Buffett once implored investors to “be greedy when others are fearful,” and this sage advice is certainly applicable to…

03.02.2026
Recent market dynamics in the software sector reflect a sharp shift in investor sentiment driven primarily by concerns that advances…
Research alerts keep you updated on our latest research publications. Simply enter your contact information, choose the research alerts you would like to receive and click Subscribe. Alerts will be sent as research is published.
We respect your privacy. We will never share or sell your information.
If you have questions or need further information, please contact us directly and we will respond to your inquiry within 24 hours.
Contact Us >