Mike Spychalski, CAIA
Vice President
On April 30, 2013 the S&P 500 Index closed at a level of 1597.57, which is the all time record high for the index. The new record high in the S&P 500, coupled with the fact that the index is up more than 105% during the four year rally since the March 9, 2009 low, has caused many market observers to speculate that the market is due for a significant correction. This week’s Chart of the Week takes a look at the trailing 12 month Price to Earnings Ratio (P/E Ratio) of the S&P 500 at inflection points of the five bear market corrections (defined as a drawdown of at least 20%) since 1970.
As the chart illustrates, with the exception of the bear market correction that began in 1980, the current 15.68 P/E Ratio of the S&P 500 is significantly lower than the valuation of the index at the inflection points of the past five bear market corrections. To put the current valuation of the S&P 500 in context, the average P/E Ratio of the S&P 500 at the end of the past five bull market runs has been 19.91, and the average P/E Ratio of the index since 1970 has been 16.39.
To be sure, the current P/E Ratio of the S&P 500 by no means guarantees that the current bull market run will continue. It does however indicate that if P/E Ratios were to return to their longer term averages (not to mention the average levels at prior inflection points), there is still significant upside potential for the U.S. equity market.

The opinions expressed herein are those of Marquette Associates, Inc. (“Marquette”), and are subject to change without notice. This material is not financial advice or an offer to purchase or sell any product. Marquette reserves the right to modify its current investment strategies and techniques based on changing market dynamics or client needs.
01.12.2026
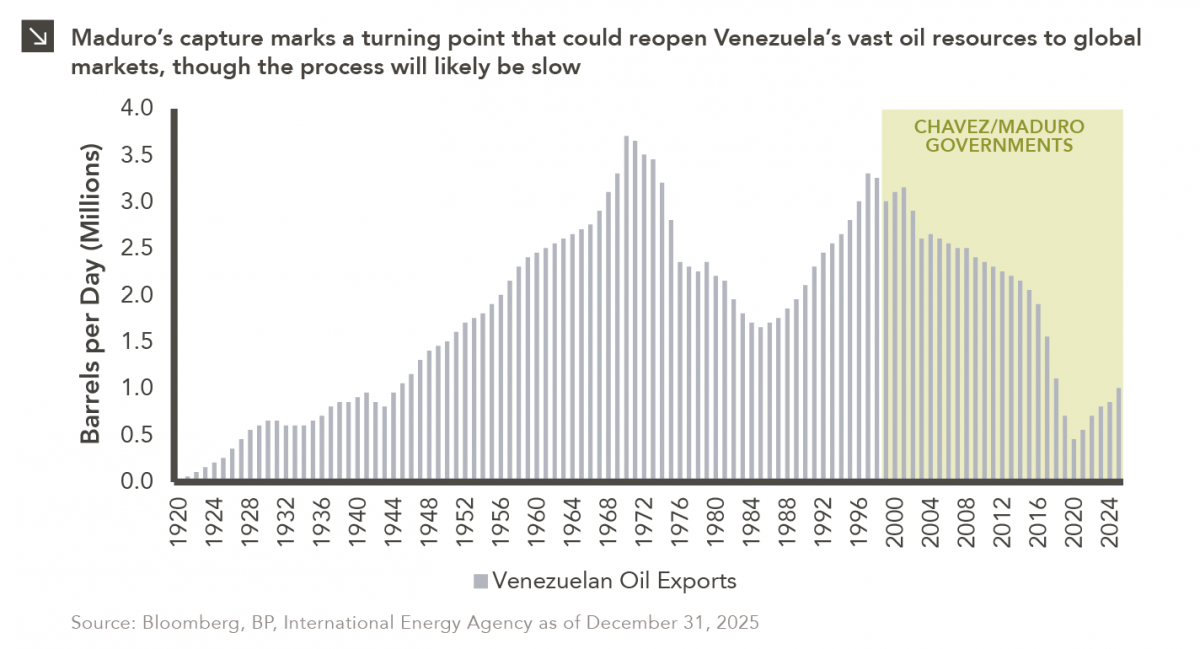
The capture of Venezuelan president Nicolás Maduro is a watershed moment for a country whose natural resource economy has been…

01.07.2026
Please join Marquette’s research team for our 2026 Market Preview Webinar analyzing 2025 across the economy and various asset classes…

01.05.2026
The development of artificial intelligence is advancing along two largely distinct paths. The first centers on generative AI powered by…
12.29.2025
While the holiday season was once marked by bustling bars, readers may notice that nightlife isn’t what it used to…
12.22.2025
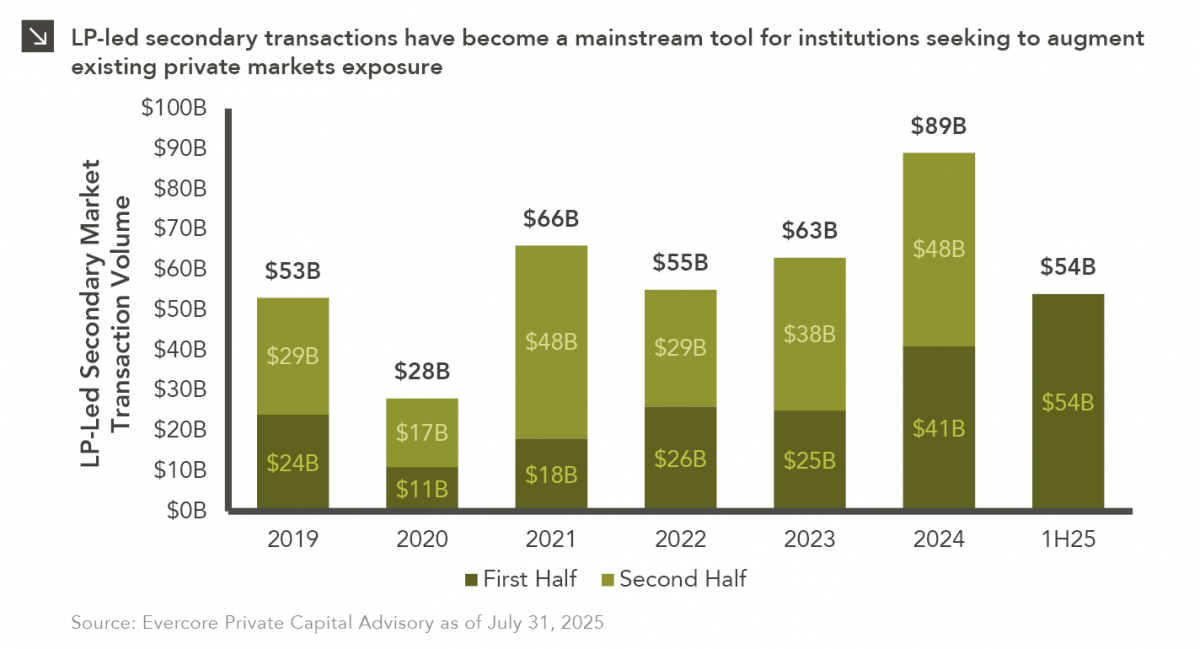
Private equity is known for being an illiquid asset class, with investments typically locked up for several years and limited…

12.15.2025
While technology-oriented firms have made their presence known in equity markets for several years, these companies have made waves in…
Research alerts keep you updated on our latest research publications. Simply enter your contact information, choose the research alerts you would like to receive and click Subscribe. Alerts will be sent as research is published.
We respect your privacy. We will never share or sell your information.
If you have questions or need further information, please contact us directly and we will respond to your inquiry within 24 hours.
Contact Us >